When working with SAP Analytics Cloud Live connections, every story, table, or chart ultimately executes a CDS-based query in the backend.
But when performance issues arise – or when you simply need to understand where data comes from – a common question appears:
Which CDS view is actually behind this SAC Live model?
This article provides a clear, repeatable method to find the underlying CDS view using standard SAP tools – no guesswork required.
Why You Need to Know the Backend CDS
- Query performance depends on CDS design
- Incorrect joins impact dashboard speed
- Troubleshooting happens in the backend
- Understanding CDS is essential for optimization
Knowing how to trace a SAC Live model to its CDS view saves hours of debugging.
Prerequisites
Before you begin, ensure you have:
- Backend Access: Authorization to use RSRT transaction and ADT (Eclipse)
- CDS Requirements: The CDS view must have the @Analytics.query: true annotation to generate analytical queries
- API Release Status: For S/4HANA contexts, the CDS must be released (typically C1 release state for BW contexts, or Released for S/4HANA)
- User Authorizations: Appropriate authorization objects for query analysis and development tools
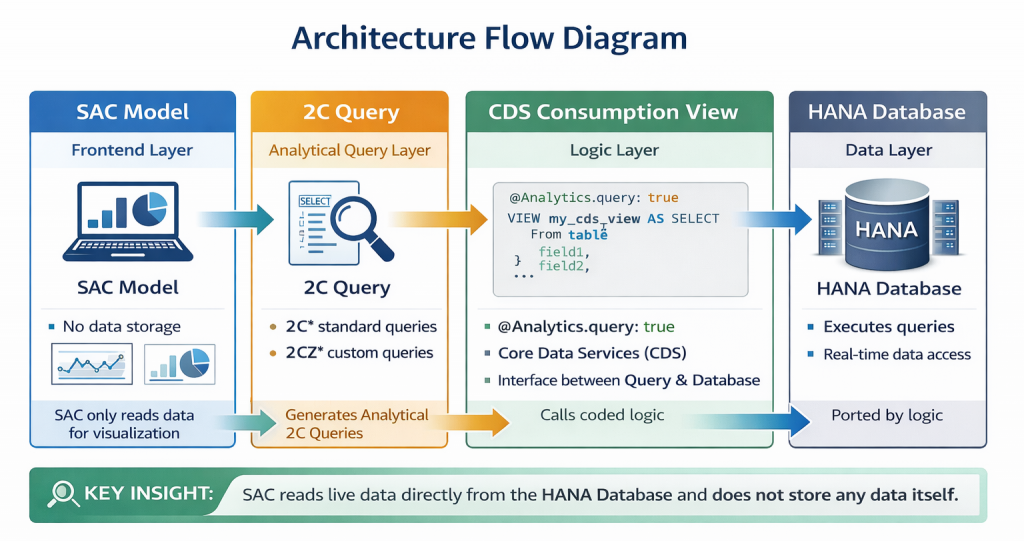
The Core Principle
Every SAC Live model connects to:
SAC Model → 2C Query → CDS Consumption View → Executed on HANA
Your task is simply to find which 2C query and CDS view the SAC model calls.
Note: This method works for both S/4HANA Live and BW Live backend connections, with minor variations noted below.
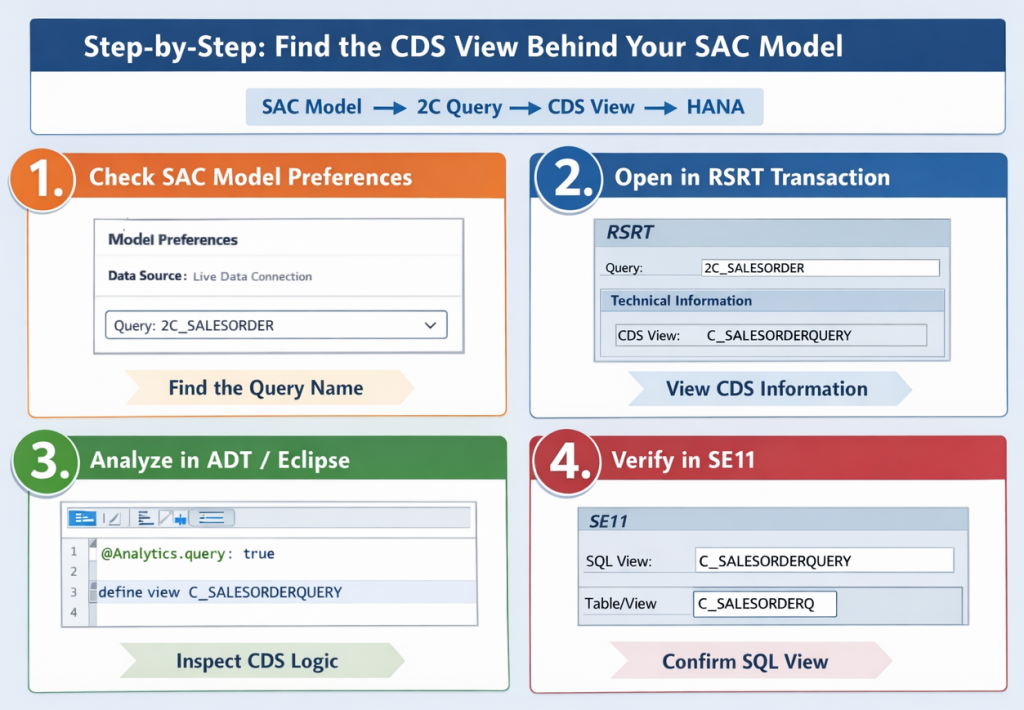
Step 1 – Identify the Query Name from SAC
In SAC:
- Open your Live Model
- Go to Model Preferences
- Check the Data Source
- Note the Query Name (usually starts with 2C… for standard queries or 2CZ… for custom queries)
This query name is your entry point to the backend.
Step 2 – Open the Query in RSRT
Transaction: RSRT
- Enter the 2C query name
- Execute
- Go to Technical Information
RSRT displays:
- The underlying CDS view name
- Associated analytical query objects
- Execution details
This is the fastest and most reliable way to find the CDS behind SAC.
Advanced Option: Use transaction RSRT2 for more detailed query analysis capabilities.
Step 3 – Inspect the CDS View in ADT
Once you have the CDS view name:
- Open ADT (Eclipse)
- Search for the CDS view using Ctrl+Shift+A (Windows/Linux) or Cmd+Shift+A (Mac)
- Review annotations, joins, associations, and calculations
Now you see exactly what SAC executes in real time.
Step 4 – Optional: Verify in SE11
If needed:
- Open SE11
- Display the SQL View Name generated by the CDS
- Confirm database-level execution objects
This helps when coordinating with Basis or DB performance teams.
Alternative Discovery Methods
| Method / Tool | How to Use | Notes / Tips |
|---|---|---|
| View Browser (Fiori Launchpad) | Open the View Browser app to see a catalog of analytical queries, including custom CDS views | User-friendly interface; good for quick exploration without backend access |
| Table RSODPABAPCDSVIEW (SE16) | Display table RSODPABAPCDSVIEW to see mappings between DDLNAME (CDS view) and SQLVIEWNAME | Useful when documentation is incomplete or for verifying CDS-to-SQL mapping |
| Direct Search in SAC | When creating a new SAC model, search by CDS technical name in the data source selection | Sometimes only works for CDS views already exposed as queries; fast for known names |
| Version-Specific Considerations | Consider backend type, embedded BW version, connection type, and query naming conventions | • S/4HANA vs BW/4HANA differences • Embedded BW 751-754 affects features • S/4HANA Live vs BW Live behaves differently • Custom queries usually prefixed with 2CZ* |
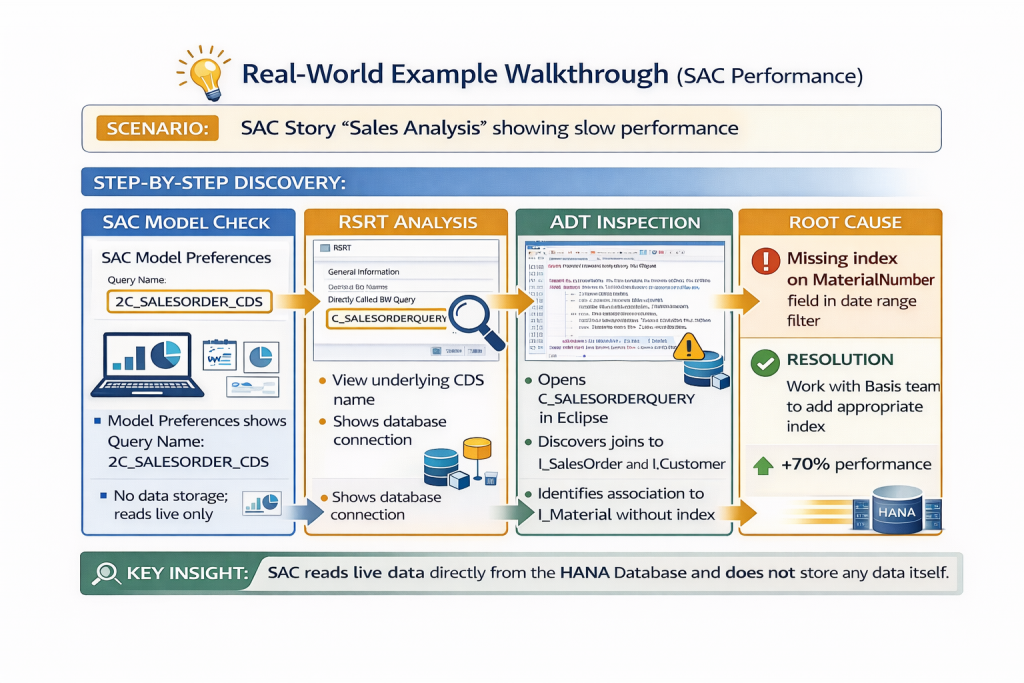
Common Troubleshooting Scenarios
| Scenario | Issue | Recommended Actions |
|---|---|---|
| Slow SAC Dashboard | Dashboard takes too long to load or refresh | • Inspect joins and calculations in the CDS view • Review aggregation levels in the consumption view • Check for missing indexes in CDS associations • Verify currency conversion logic placement • Compare calculated fields vs database-level calculations |
| Wrong Data Displayed | Numbers do not match expectations or other reports | • Verify filters and associations in the consumption CDS • Check user-specific authorizations that may filter data • Review variable default values • Examine date and time zone handling |
| Query Fails in SAC | Error message appears when running a SAC story | • Test directly in RSRT to isolate backend errors • Check authorization objects • Verify OData publication settings • Review SAC connection configuration |
| Custom CDS Not Appearing in SAC | Newly created CDS view does not show in SAC model creation | • Verify API release status (must be Released) • Confirm CDS has @Analytics.query: true annotation • Check naming convention (2CZ* for custom queries) • Ensure proper activation in ADT • Verify user authorization to access the query |
| Query Works in RSRT but Fails in SAC | Query executes in RSRT but errors occur in SAC | • Check authorization differences between backend and SAC user • Verify OData service publication • Review SAC connection settings • Examine variable handling differences |
| Data Discrepancy Between RSRT and SAC | Same query returns different results | • Compare variable values and filters applied • Check user-specific authorization restrictions • Verify data execution timestamps • Review SAC story-level filters |
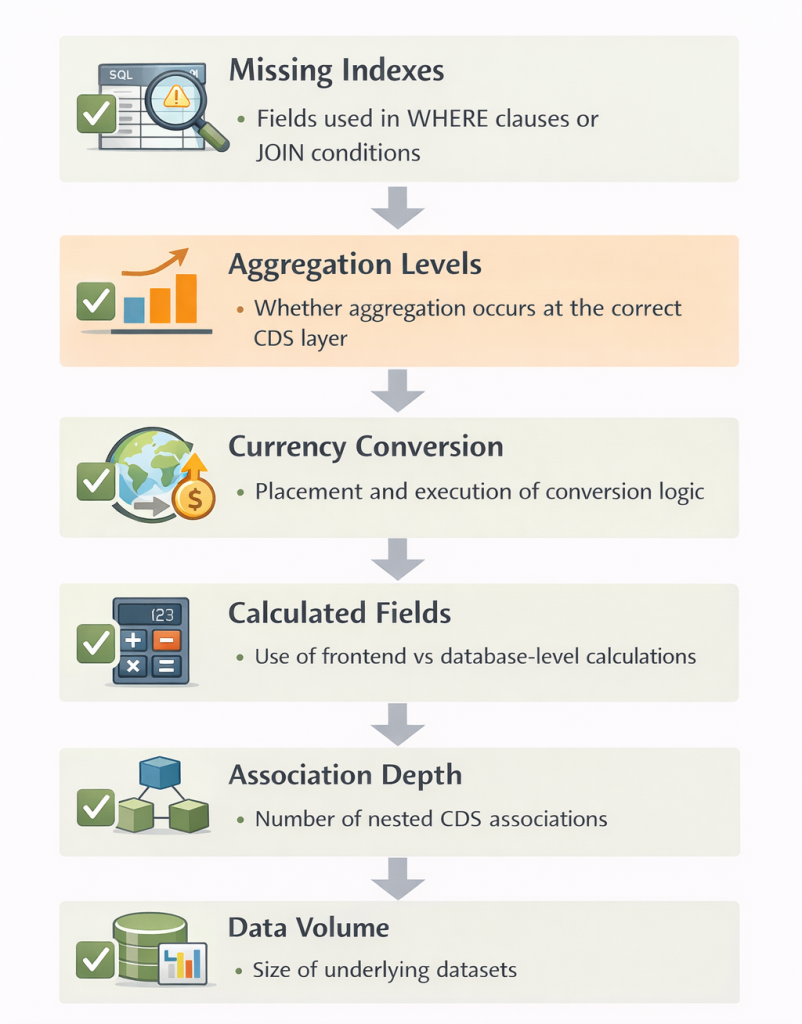
Performance Optimization Tips
When inspecting CDS views, check for these common performance issues:
| Area to Check | What to Look For | Why It Matters |
|---|---|---|
| Missing Indexes | Fields used in WHERE clauses or JOIN conditions | Missing indexes cause full table scans and slow query execution |
| Aggregation Levels | Whether aggregation occurs at the correct CDS layer | Incorrect aggregation increases data transfer and processing time |
| Currency Conversion | Placement and execution of conversion logic | Inefficient conversion logic significantly impacts runtime performance |
| Calculated Fields | Use of frontend vs database-level calculations | Database-side calculations execute faster and reduce data volume |
| Association Depth | Number of nested CDS associations | Deep association chains increase join complexity and response time |
| Data Volume | Size of underlying datasets | Large unarchived datasets slow down live query execution |
Additional Analysis Tools
1. SQL Trace (ST05)
| Purpose | Key Notes | |
|---|---|---|
| ST05 | Deep performance debugging at the database level | Shows actual SQL statements executed and provides performance metrics |
2. HANA Studio / Cockpit
| Purpose | Key Notes | |
|---|---|---|
| HANA Studio / Cockpit | HANA-specific query and system analysis | • Review execution plans • Analyze expensive statements • Check column store optimization • Monitor memory consumption |
3. Performance Analysis Tools
| Purpose | Key Notes | |
|---|---|---|
| RSRTRACE | Detailed query runtime analysis | Focused on CDS queries and 2C queries |
| SAT | Runtime analysis for ABAP code | Useful for embedded analytics and custom logic |
| HANA Performance Tools | System and query performance monitoring | Access through HANA Studio or Web IDE |
Quick Reference Cheat Sheet
Eclipse (ADT)
- Ctrl+Shift+A (Win/Linux) or Cmd+Shift+A (Mac): Search CDS views
- F3: Navigate to definition
- Ctrl+Shift+G: Find where CDS is used
Key Transactions
- RSRT: Query analysis and technical information
- RSRT2: Advanced query analysis
- SE16: Table RSODPABAPCDSVIEW for CDS mappings
- SE11: SQL view verification
- ST05: SQL trace
- SAT: Runtime analysis
Common CDS Annotations
| Annotation | Purpose | Why It Matters |
|---|---|---|
| @Analytics.query: true | Makes the CDS view available as an analytical query | Required for the CDS to appear as a 2C query and be accessible to SAC Live |
| @Analytics.dataCategory: #CUBE | Defines the CDS as an analytical cube | Enables measure/dimension behavior for analytical consumption |
| @OData.publish: true | Publishes the CDS view as an OData service | Allows external tools like SAC to consume the view via live connection |
Documentation and Governance
| Practice Area | Recommended Actions | Business Value |
|---|---|---|
| Maintain a CDS Registry | • Map SAC Model → 2C Query → CDS View → Business Purpose • Record owner and contact details • Track last modification date • Store performance benchmarks | Creates transparency, accelerates troubleshooting, and prevents knowledge loss |
| Version Control Best Practices | • Track CDS changes in transport requests • Document business reasons for modifications • Maintain a changelog for critical analytical queries • Test performance impact before production release | Ensures controlled change management and avoids unexpected performance regressions |
| Team Knowledge Sharing | • Create internal wiki pages for CDS architecture • Document custom naming conventions • Share common troubleshooting scenarios and solutions | Builds team expertise and reduces dependency on individual experts |
Integration with Modern SAP Tools
| Area | Key Points | Why It Matters |
|---|---|---|
| SAP Datasphere Considerations | • Datasphere can expose CDS views with data access controls • Discovery methods are similar, via Datasphere modeling interface • Decide whether to expose CDS directly or through Datasphere | Ensures secure, controlled access to analytical data and simplifies governance |
| Evolving SAC Architecture | • Growing use of SAP Datasphere as an intermediary layer • Enhanced metadata exploration tools within SAC • Improved direct integration with S/4HANA embedded analytics | Helps teams stay current with SAC capabilities and leverage new performance and integration improvements |
Best Practice Tip
Always validate CDS consumption views in RSRT before exposing them to SAC Live.
If a query performs poorly in RSRT, it will perform poorly in SAC.
Test with realistic data volumes and user authorization profiles to avoid surprises in production.
Key Takeaways
- SAC Live executes backend CDS-based queries in real time
- The SAC model points to a 2C query (or 2CZ for custom)
- RSRT reveals the underlying CDS view quickly and reliably
- ADT is used for deep inspection of CDS logic
- Troubleshooting belongs in the backend, not in SAC
- Multiple discovery methods exist for different scenarios
- Performance optimization happens at the CDS and database level
Final Thought
Many SAC Live issues are not SAC problems at all – they are CDS modeling or query design problems. Once you master CDS discovery and analysis, troubleshooting becomes fast, structured, and predictable.
The key is understanding the full chain: SAC → Query → CDS → HANA. Master each link, and you’ll resolve issues efficiently while building better analytical solutions from the start.
Next, we will review how SAP Analytics Cloud Live queries execute these CDS views – from the HANA engine through RSRT and into SAC.