Bringing Predictive Power to Business Users
The future of business relies on prediction – understanding not just what happened, but what will happen next. Moreover, SAP Analytics Cloud Smart Predict brings this capability to every business user, making advanced analytics intuitive and accessible. Through its Classification Model, organizations can identify patterns in their data and predict outcomes like fraud/not fraud or churn/stay to make smarter, faster decisions.
What Is a Classification Model?
A classification model identifies the category to which a new observation belongs based on historical data. For example:
- Will a customer switch to another mobile provider?
- Is a credit card transaction fraudulent?
- Will an employee resign in the next quarter?
SAC Smart Predict captures these outcomes using a target variable, often binary (1 = yes, 0 = no). Then, the model learns from historical data – the training dataset – to predict the probability of a similar event happening again.
Building the Model: From Data to Insight
To build a classification model, you start by preparing a training dataset. This dataset includes past records with known outcomes (targets) and the descriptive variables, or influencers, that explain them – such as age, income, location, or behavior. During model training, Smart Predict automatically explores the relationships between influencers and the target to find the best predictive patterns. Once completed, the model’s status updates from Not Trained to Trained, and it’s ready for evaluation.
Understanding Variable Roles
Each variable in your dataset plays a key role:
- Target Variable: The outcome you want to predict (e.g., whether a customer will churn).
- Influencer Variables: Factors that help explain the target (e.g., contract type, customer tenure).
Additionaly, SAC also allows you to exclude certain variables – known as leakers – that might bias the model because they contain information directly derived from the target.
Evaluating the Model: Accuracy and Insights
Once your model is trained, SAC provides detailed reports to help you interpret and trust the results. Key metrics include:
- Confusion Matrix: Compares predicted versus actual outcomes, identifying correct and incorrect predictions.
- Influencer Contributions: Highlights which variables most impact the prediction outcome.
- Performance Curves and Profit Simulations: Help you understand thresholds and maximize profit based on operational parameters.
In this way, these visual reports make it easier for business users to assess how reliable and actionable their predictions are.
Predictive Power and Prediction Confidence
Two core indicators define how strong and reliable your predictive model is: Predictive Power and Prediction Confidence.
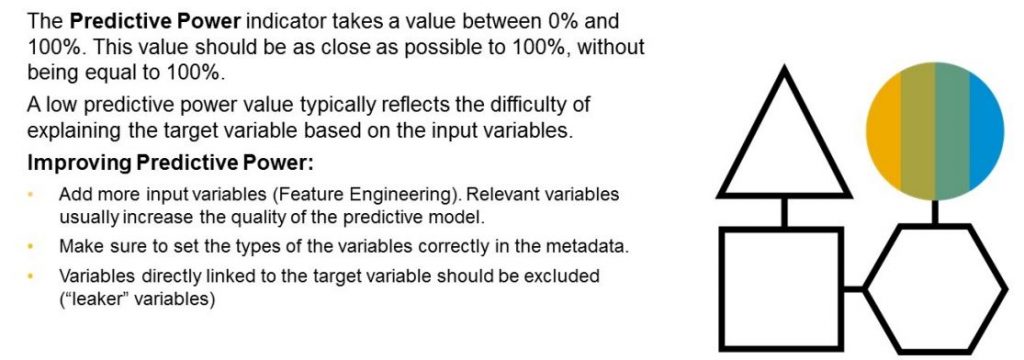
Predictive Power measures how effectively your model predicts the target variable based on the influencers in the training dataset.
It ranges from 0% to 100%:
- A value close to 100% means your model explains most of the target’s behavior – it’s highly predictive.
- A value of 0% means the model performs randomly, offering no useful insights.
A perfect 100% score, however, is often a sign of overfitting, meaning the model fits the training data too perfectly and may not generalize well. To improve Predictive Power, you can include more meaningful influencer variables or refine your data quality.
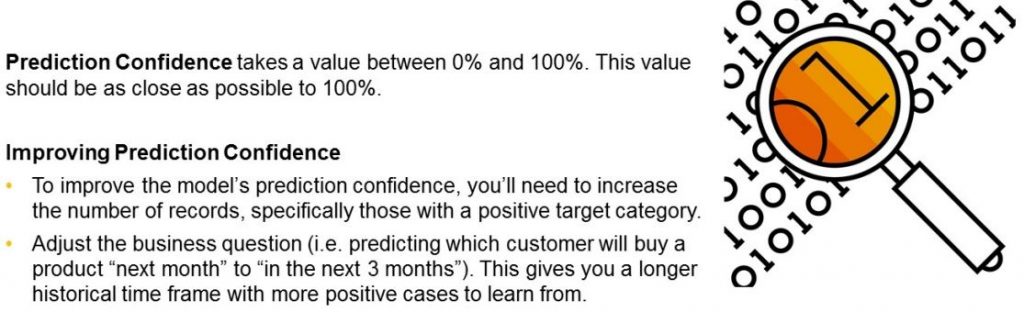
Prediction Confidence assesses how consistently your model performs on new, unseen data.
It also ranges between 0% and 100%, with higher values indicating that the model will likely maintain accuracy when applied to future datasets.
To enhance Prediction Confidence, you can increase the number of training observations or ensure your data represents diverse scenarios.
Together, these two measures ensure your model is both accurate and trustworthy – capable of delivering reliable predictions across changing business conditions.
Applying and Operationalizing the Model
After you validate the classification model, you can apply it to new data – the application dataset – to generate predictions. SAC ensures a smooth operational process:
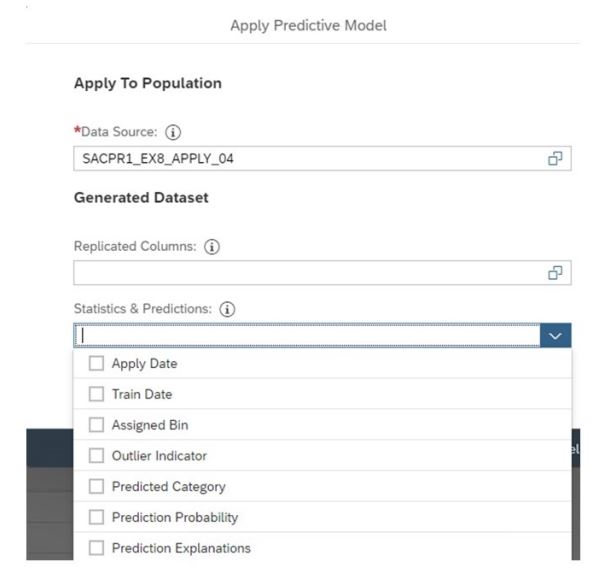
- Open the predictive model and select Apply Predictive Model.
- Choose your new dataset.
- Define output columns (e.g., predicted category, prediction probability, influencer explanations).
- Apply the model, and SAC writes the results to SAP HANA for visualization in BI stories
This integration allows predictive insights to flow directly into your dashboards and planning processes.
Statistics and Predictions
When applying a classification model to a new dataset, SAC Smart Predict lets you select which statistics and predictions to include in the output. This gives additional context for each predicted record, making analysis and decision-making easier. Options include:
- Apply Date indicates when you apply the model, and Train Date shows when you trained it.
- Assigned Bin:
Groups observations by predicted probability (10 bins), helping monitor population changes or model performance shifts. - Outlier Indicator:
Flags rows with unusually high prediction error (1 = outlier, 0 = normal). - Predicted Category & Prediction Probability:
Displays the predicted outcome and its probability. - Prediction Explanations:
Shows which influencer variables contributed most, including the strength and direction of their impact.
Including these statistics allows business users to:
- Understand why the model predicted a specific outcome.
- Identify high-risk or high-opportunity segments.
- Monitor and track model performance over time.
Model Output Data
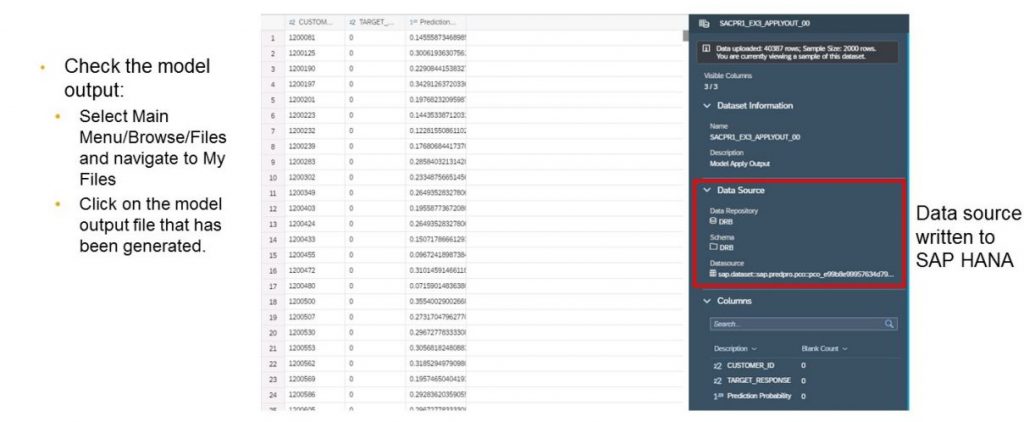
Once you apply a classification model, SAC saves the predicted results as a new dataset.
- Output Location: SAC stores the results in SAP HANA, for seamless integration with BI stories and dashboards.
- Accessing the Data: Navigate to Main Menu → Browse → Files (or your predictive scenario folder) to open the output dataset and examine predictions, probabilities, outliers, assigned bins, and explanations.
- Business Use: You can consume this dataset to drive marketing campaigns, monitor risk, forecast customer behavior, or support planning decisions.
Gaining Deeper Understanding with Bins and Explanations
SAC Smart Predict further enhances interpretability through advanced features:
Assigned Bins
Observations fall into 10 bins according to their predicted probability. Monitoring these bins helps detect shifts in population behavior or model performance over time.
Prediction Explanations
For each prediction, SAC provides explanations showing which influencer values contributed to the predicted outcome. Positive strengths push predictions toward the target, while negative strengths push them away. This transparency allows business users to trust and act on model results
From Prediction to Action
After generating predictions, you can directly use the results in SAP Analytics Cloud stories to support planning, campaign optimization, and decision-making. Organizations can identify at-risk customers, refine marketing strategies, or prioritize high-value prospects – all within one analytics platform.
Conclusion: Making Data Work for You
The Classification Model in SAP Analytics Cloud Smart Predict bridges the gap between business intuition and machine learning. Ultimately, it enables users to make informed, data-driven decisions – without coding or complex algorithms. By leveraging historical data, identifying key influencers, and continuously monitoring performance, organizations can turn predictive insights into actionable business strategies
In our next blog, we’ll explore Time Series Model in SAC Smart Predict – from building and applying models to analyzing and interpreting results.