Predictive analytics isn’t just for data scientists anymore. Moreover, SAP Analytics Cloud brings its power to every business user through Predictive Scenarios – a feature that makes forecasting faster, smarter, and easy to use.
With a Predictive Scenario, you get a guided workspace to build, train, and deploy predictive models that answer real business questions. Whether you’re predicting sales, spotting customers likely to churn, or improving operational performance, SAC provides all the tools you need in one seamless environment. As a result, predictive analytics becomes accessible, intuitive, and actionable for everyone.
Creating a Predictive Scenario in SAP Analytics Cloud
To create a predictive scenario:
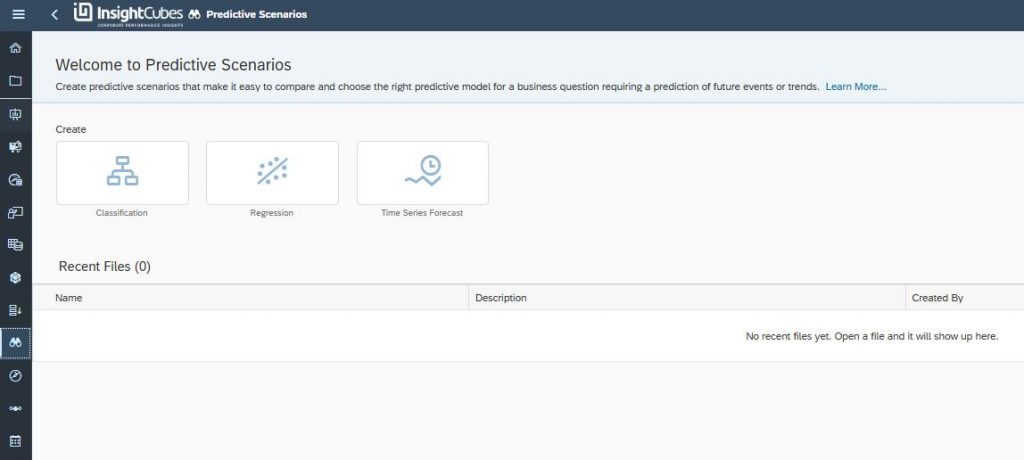
- Go to Predictive Scenarios in the SAC menu.
- Choose a Classification, Regression, or Time Series Forecasting scenario.
- Enter a meaningful name and description that defines your business question.
- Click OK to create your predictive scenario.
Afterward, you can add one or more predictive models, compare performance metrics, and select the model that provides the most accurate results.
Types of Predictive Scenarios
- Classification – Predict categorical outcomes, such as whether a customer will buy or not.
- Regression – Predict continuous numerical outcomes, like sales revenue or cost.
- Time Series Forecasting – Forecast future trends based on historical data, such as monthly sales or inventory demand.
In addition, each type of predictive scenario leverages SAC Smart Predict to optimize accuracy and insights.
Understanding Data Types and Storage Variables
Each variable in your dataset represents a column, and each row represents an observation. Variables can be quantitative (numerical) or qualitative (categorical), and they play specific roles in predictive models.
| Quantitative or Numerical Data | Qualitative or Categorical Data |
|---|---|
| Data are numbers and can be quantified | Data are not numbers, or if they are, they cannot be quantified |
| Can be classified as discrete or continuous | Data items can be placed into distinct categories based on characteristics |
| Can be counted or measured and summarized using mathematical operations (addition, multiplication) | Can only be summarized by frequency count (mode); no mathematical operations apply |
| Examples: Age, Height, Grade Score, Salary. | Examples: Gender, Race, Grading System (A/B/C), Income Level (low/medium/high). |
Statistical Types in SAP Smart Predict
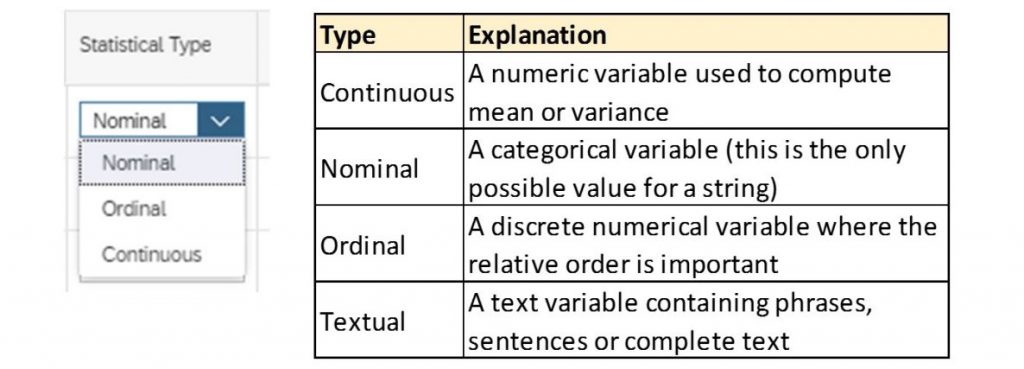
SAC Smart Predict recognizes 3 main statistical variable types:
| Nominal Variables | Represent discrete, unordered categories (e.g., gender, eye color, zip code). No mathematical operations can be performed. Example: Zip Code = 90210 or Eye Color = Brown. |
| Ordinal Variables | Represent ordered categories (e.g., education level, satisfaction rating). Values can be ranked but not measured in exact numerical intervals. Example: Satisfaction = Low, Medium, High. |
| Continuous Variables | Represent numerical values that can take any value within a range. Support arithmetic operations such as addition and multiplication. Example: Income = $35,000, Weight = 70 kg, Age = 28 years |
Roles of Variables in Predictive Modeling
Each variable serves a specific role within a predictive scenario:
| Role | Description |
|---|---|
| Target (Signal) Variable | The variable you want to predict (e.g., sales amount, customer response) |
| Date Variable | Defines the time dimension for forecasting models |
| Entity | Segments the data into subsets (e.g., region, product line) |
| Influencers | Independent variables that help explain or predict the target |
However, avoid including “leaker” variables that reveal the target outcome, as they can make your model appear accurate but fail in real predictions.
Data Preparation and Automated Encoding
Automated Data Encoding
SAC Smart Predict automatically encodes data based on statistical type (nominal, ordinal, or continuous). Correct metadata ensures accurate encoding and stronger models.
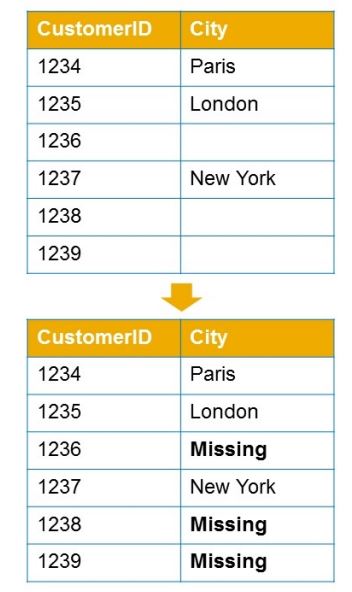
Handling Missing Values
Missing values are empty or unavailable entries in your dataset. SAC Smart Predict handles them automatically by replacing missing values with a constant labeled “Missing”, allowing the model to include these cases in analysis rather than ignoring them. This ensures that all data points contribute to accurate predictions.
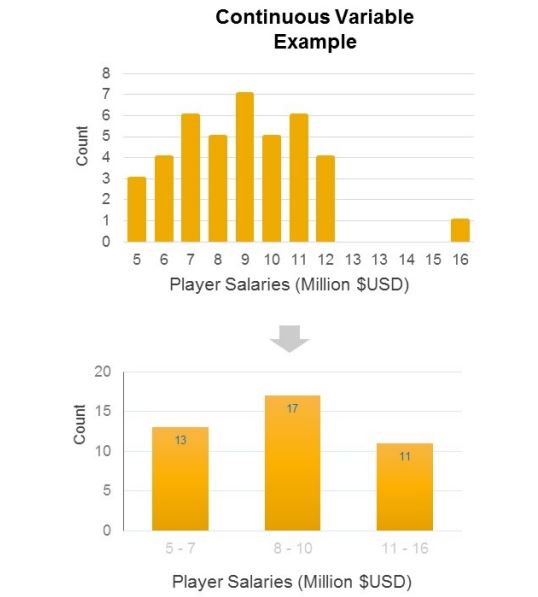
Dealing with Outliers
Outliers are unusual values that can distort predictive models. SAC Smart Predict handles them automatically:
- For categorical variables, rare categories are grouped into “Other.”
- For continuous variables, extreme values are binned to reduce distortion.
This ensures your model remains accurate and reliable.
Editing Column Details
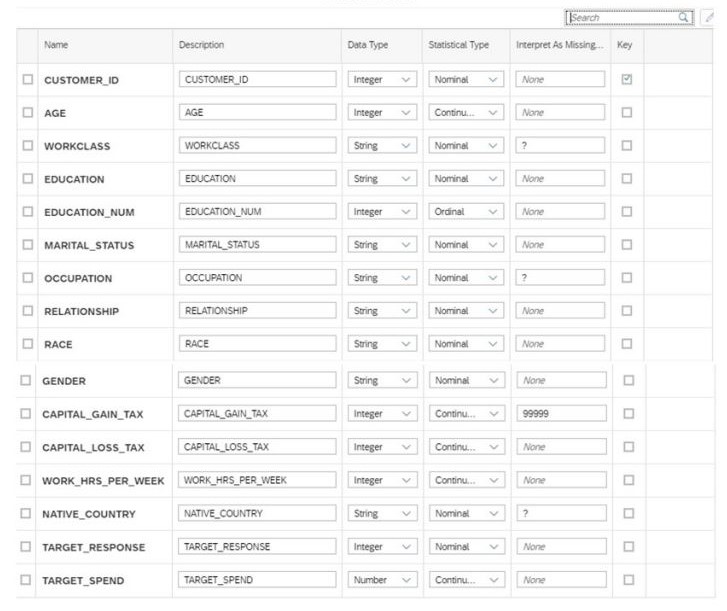
Before training your model, it’s crucial to review and adjust metadata via Edit Column Details in SAC:
- Confirm the correct Data Type (String, Integer, Number, Boolean, Date, etc.)
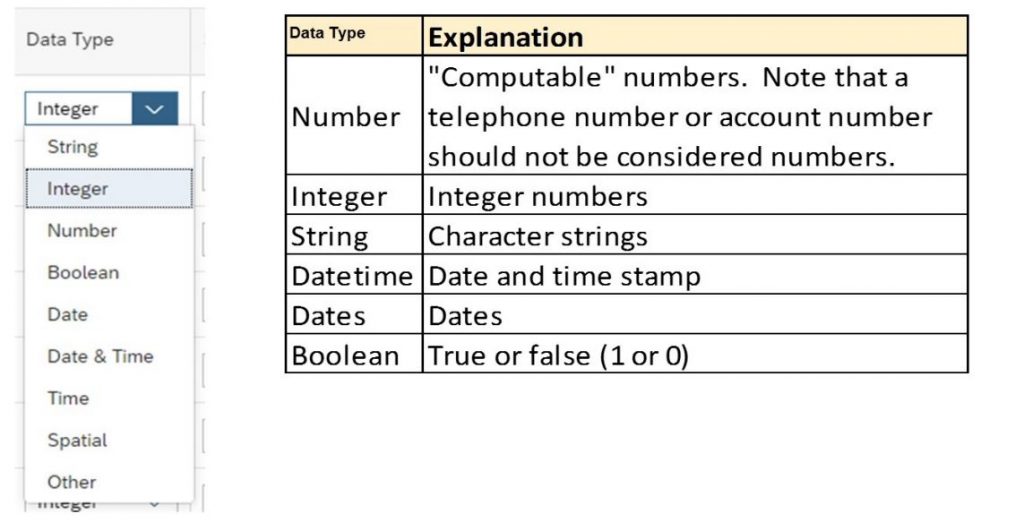
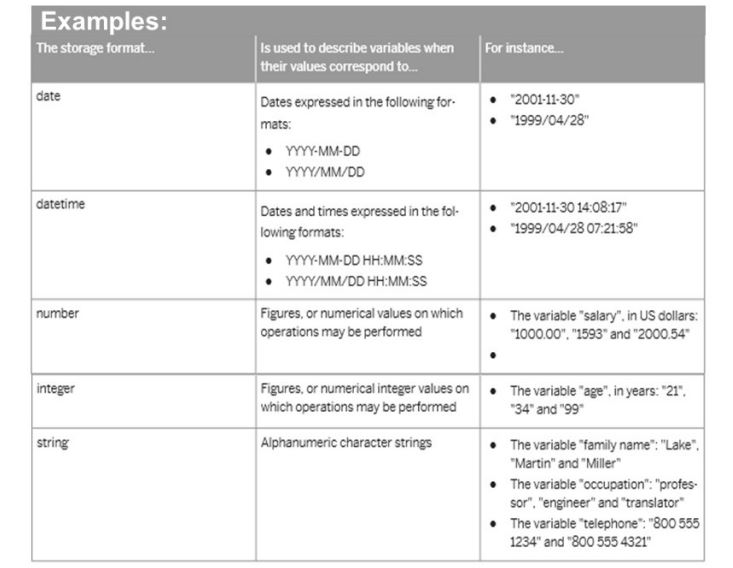
- Verify the Statistical Type (Nominal, Ordinal, Continuous).
- Define how missing values should be interpreted (e.g., “999”, “#NA”, or “#Empty”). This ensures your data encoding and model performance are optimized.
Why Predictive Scenarios Matter
With SAP Analytics Cloud Smart Predict, businesses can easily transition from traditional reporting to predictive analytics. Therefore, users can:
- Anticipate customer behavior and market trends.
- Improve demand planning and resource allocation.
- Detect performance anomalies early.
- Make data-driven decisions backed by machine learning insights.
Conclusion
SAP Analytics Cloud Predictive Scenarios combine automation, advanced algorithms, and intuitive design to make predictive analytics accessible to every business user. By mastering data types, variable roles, and encoding principles, you can create robust predictive models that transform your data into actionable intelligence. Ultimately, unlock smarter forecasting and gain a competitive edge with SAP Analytics Cloud Smart Predict
Stay tuned for the next post, where we’ll examine Augmented Analytics, explore Smart Predict use cases, and explain how to work with predictive outputs in SAC