SAP Analytics Cloud Starter Kit for Business Planning and Consolidation
SAP BPC Reporting for SAP Analytics Cloud
BPC Reporting on SAC: Standard & Enhanced Model Reporting & Planning
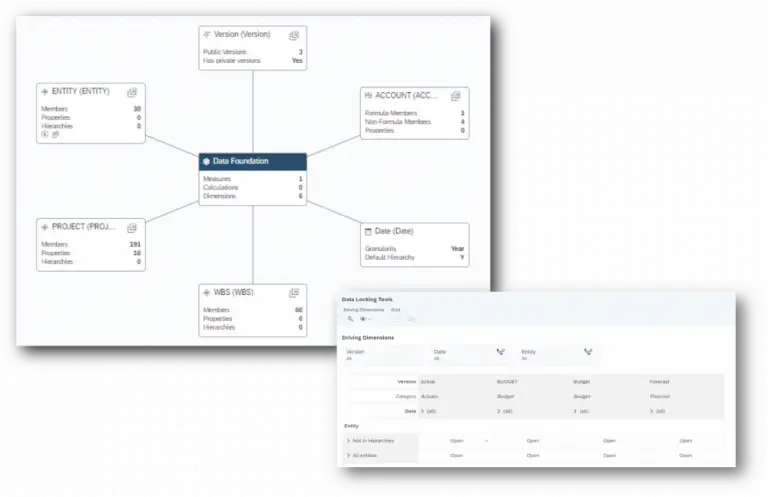
Standard SAC planning model that replicates the IFRS BPC Consolidation model architecture.
The SAC Consolidation reporting and planning model inherits the SAP BPC Consolidation model. It uses the native BPC 10.1 or 11 connection. By mapping the dimensions to the source, you can update characteristic Master, text, attributes and hierarchies.
BPC Reporting on SAC model allows for:
- Reporting of actual values through a set of stories – Standalone, consolidated, and staged
- Reporting of actual values through a set of Analytic Applications Smart Insights report
- Entry of standalone and consolidated Budget, Estimates and forecast Conversion of the entered standalone values to reporting currencies Calculation of 45+ preconfigured KPIs
- Allocation rules (from a set of entities within a scope to a staging company)
- Preconfigured Cross calculations and advanced filter features
- AI linear regression
- NLP through pattern-based functions
- Level Based Hierarchy for Scope and Parent-Child Hierarchy for all remaining dimensions except version (natively flat) Data Locking
- Workflow (performer and reviewer)
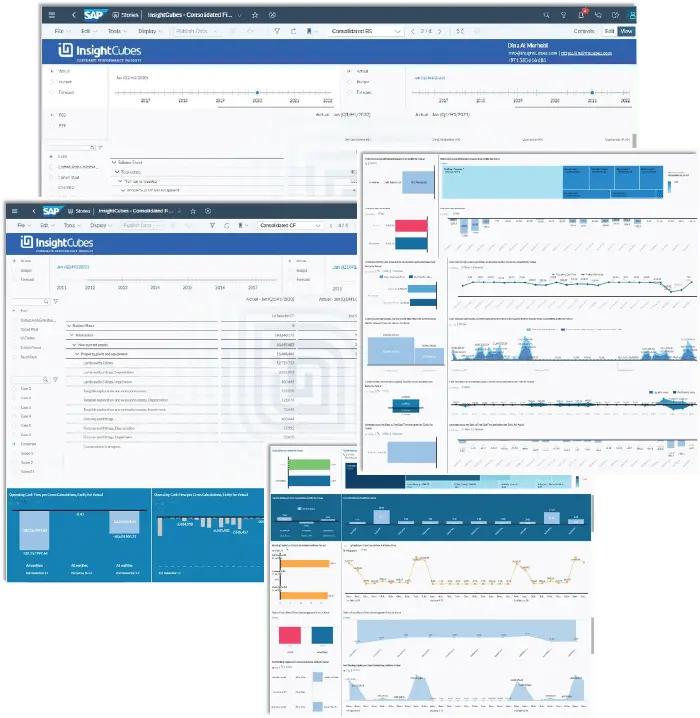
BPC Reporting on SAC: Stories
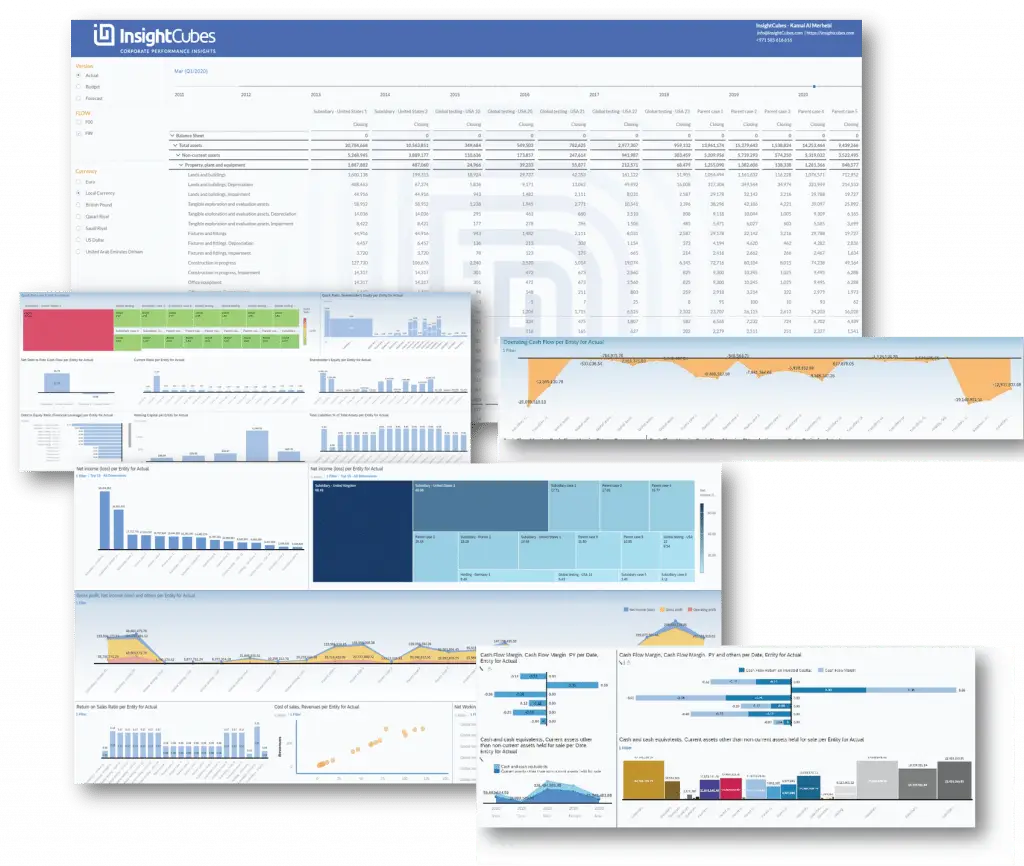
Standalone Financial Insights
Balance sheet, Profit & Loss, Cashflow and KPI with set of charts and filters
This standalone reports have a single value slider for time, and set of selections for entity, currency, flows and version. Each tab in the Standalone Financial Insight is for a specific financial statement. The table would list the balance sheet, P&L or Cashflow, for the selected entities, version, flow and currency. Meanwhile, a set of charts/graphs will provide visual insight to each KPI relevant to the financial statement.
The financial statements in each tab includes a set of charts with linked analysis, so that selection of a specific entity within the chart can influence other charts, if required. Multiple types of charts used:
- Bar
- Combined
- Waterfall
- Stacked bar and column
- Trend – Line
- Trend – Timeseries
- Trend – Stacked area
- Heat
- Tree map
- Donut
- Pie
- Marimekko
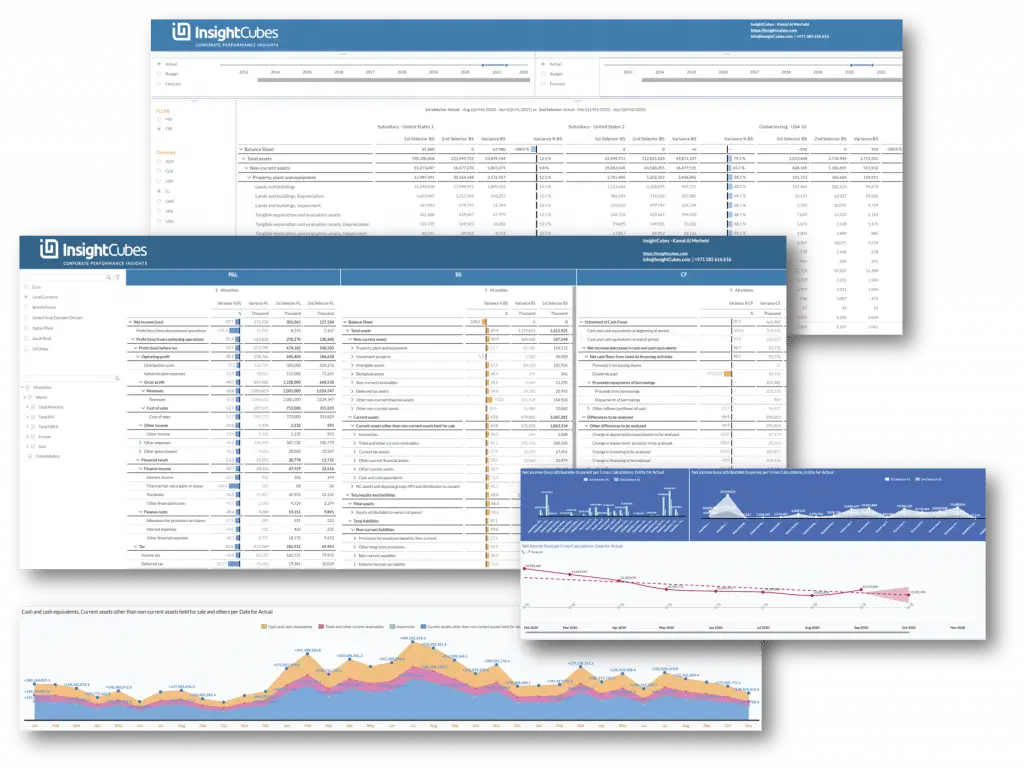
Standalone – Cross Calculation Dual Range
The Cross calculation Dual Range report sums up a set of periods, for each time range and specific category.
These set of reports are useful when the consolidation is periodic, or when several months need to be summed up and compared to a corresponding selection.
The reports allow users to select multiple months from two different time ranges and two versions. The report will list the cross-calculation results per each for the selected entities, flows, categories, and calculate the variance & variance % between them
All the KPIs and their corresponding graphs and charts will include this form of logic to derive the visual comparisons.
The Summary report includes the balance sheet, P&L and Cashflow. The selection made in each corresponding tab will influence the section in the summary report automatically.
Each sheet has its own 2 cross calculations, and the variance calculations linked to their results. All the table reports include embedded graphs in the Variance percentage column. Linked analysis in some of the graphs and time series with forecast is independent of the time range selections.
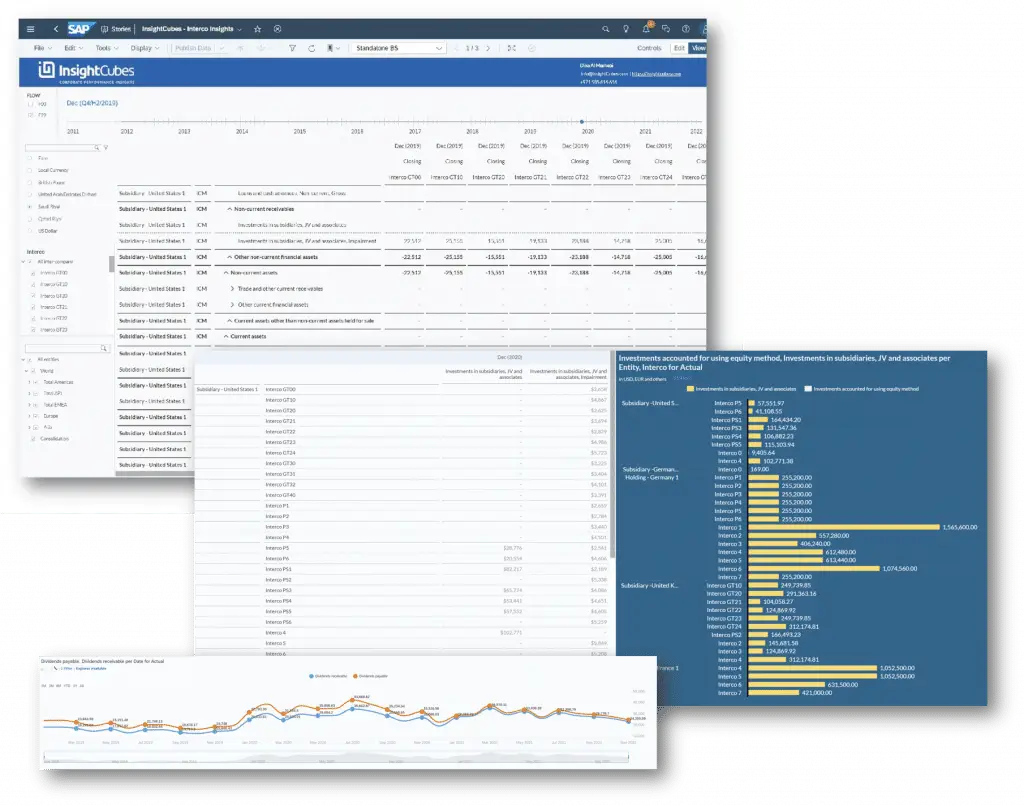
Standalone – Intercompany Insights
A centralized model that is designed to automatically derive the concise profitability and cost per object, after a set of allocation procedures.
The intercompany story includes a set of reports and graphs to cover:
- Balance sheet intercompany accounts
- Profit and Loss Intercompany Accounts
- Dividends payable & Dividends Receivables
- Investment Breakdown
The reports will display the entities with affiliates and subsidiaries, for each intercompany account for the selected month, flow and currency.
The standard model will always display the parent accounts, whereas the enhanced model will show the base level account and/or parent accounts.
The Balance sheet and Profit and loss intercompany will list the entities and accounts in the rows, and the time, flow and partners in the columns.
Meanwhile, the investment and dividend will have a different structure.
Several graphs are created in a manner relevant to the purpose of the report. breakdown of the value per each intercompany, for the entity or time series of total investment per entity are just a few.
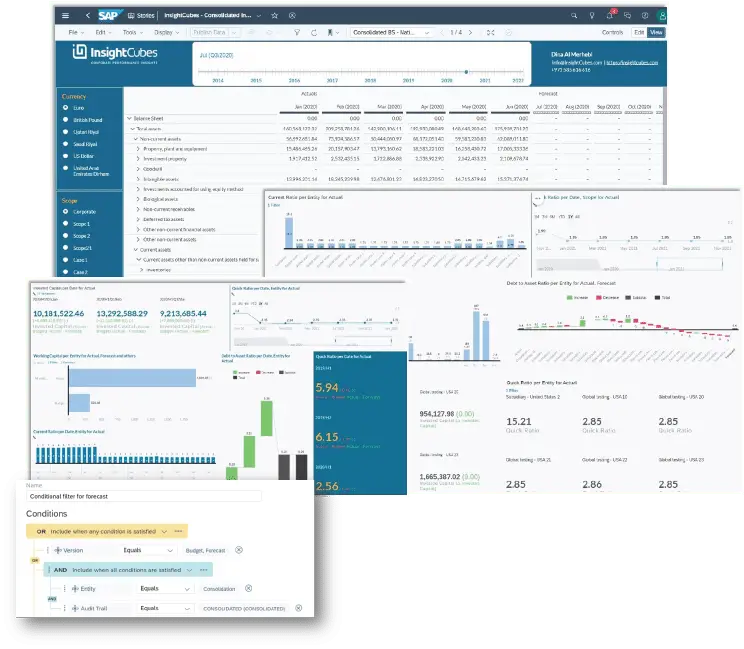
Consolidated – Cross Calculation Dual Selection
The Cross calculation Dual Selection allows for comparison of two time periods & version. (Unlike the dual range, it will not sum up periods)
These set of reports are useful when the consolidation is YTD, or when the values are cumulative and do not need to be summed up for reporting and analytics.
The reports allow users to select a single month from two different time ranges and two versions. The report will list the cross-calculation results per each for the selected Scopes, flows, categories, and calculate the variance & variance % between them
All the KPIs and their corresponding graphs and charts will include this form of logic to derive the visual comparisons.
The Summary report includes the balance sheet, P&L and Cashflow. The selection made in each corresponding tab will influence the section in the summary report automatically.
Each sheet has its own 2 cross calculations, and the variance calculations linked to their results. All the table reports include embedded graphs in the Variance percentage column. Linked analysis in some of the graphs and time series with forecast is independent of the time range selections.
Consolidated – Budget & Forecast Input
A set of input templates configured to allow entry of consolidated budget and forecast values
The templates are designed to allow the users to select a scope and conduct entry. One set of templates will store the values using the native disaggregation, meaning onto all the entities within a scope, meanwhile the second will automatically store the values on a staging entity that represents the scope.
The first two templates are labeled as Native. When entering consolidated budget and forecast values, they will be disaggregated on all the entities within the selected scope.
Meanwhile, when using custom templates, an advanced filter is created to confine the Budget and Forecast entries to a specific Audit Trail and Entity, meanwhile showing the total actuals for all entities and audit trails, for a specific scope.
If each scope has a specific staging entity, the same can be used by specifying the condition (for scope A, Staging entity A) or by using Consolidated – Budget & Forecast Cross Calculation Input
BPC Reporting on SAC: Analytic Applications
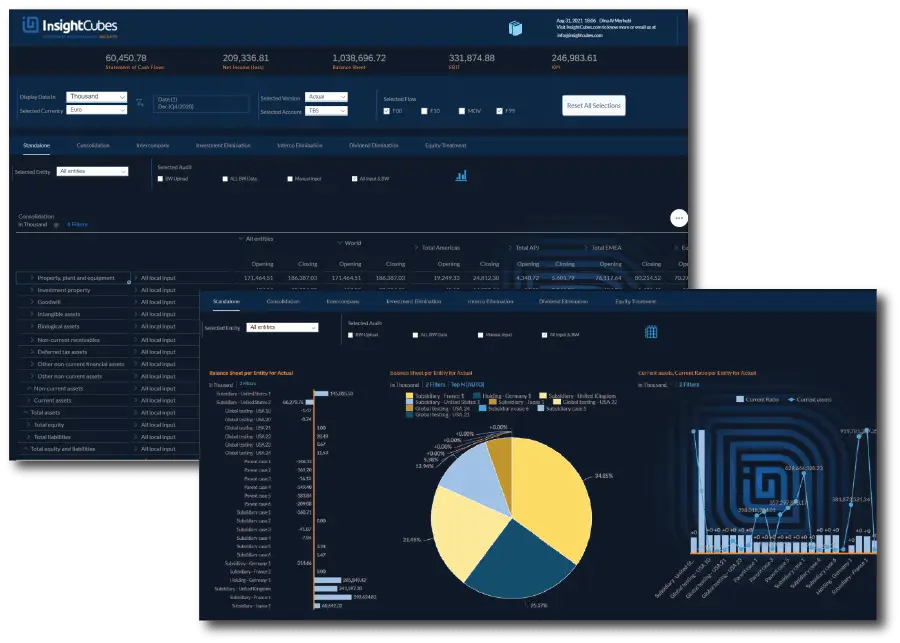
Comprehensive Analytics Application - Standalone
The standalone dynamic report provides all the functionalities to report on any financial statement, based on preconfigured selections
With the Standalone tab, the user can generate Balance sheet, Profit and loss and cashflow reports for a specific Entity or set of entities.
The interface allows selection one of multiple flows, based on the financial statement, and audit trails. Users can also select the Version and Currency.
The reported values can be displayed in full format, thousands or millions. The Report has a fixed structure, whereas Account and Audit Trail will be listed in Rows, as for entities and Flows in columns. The remaining dimensions are part of the filter.
By clicking on the graph icon, you will be able to see the following graphs:
- Combination of stacked column and line graph for Balance sheet per Entity for Actual
- Pie Chart for Balance sheet per Entity for Actual
- Bar/Column Chart for Current Assets and Ratio per Entity for Actual
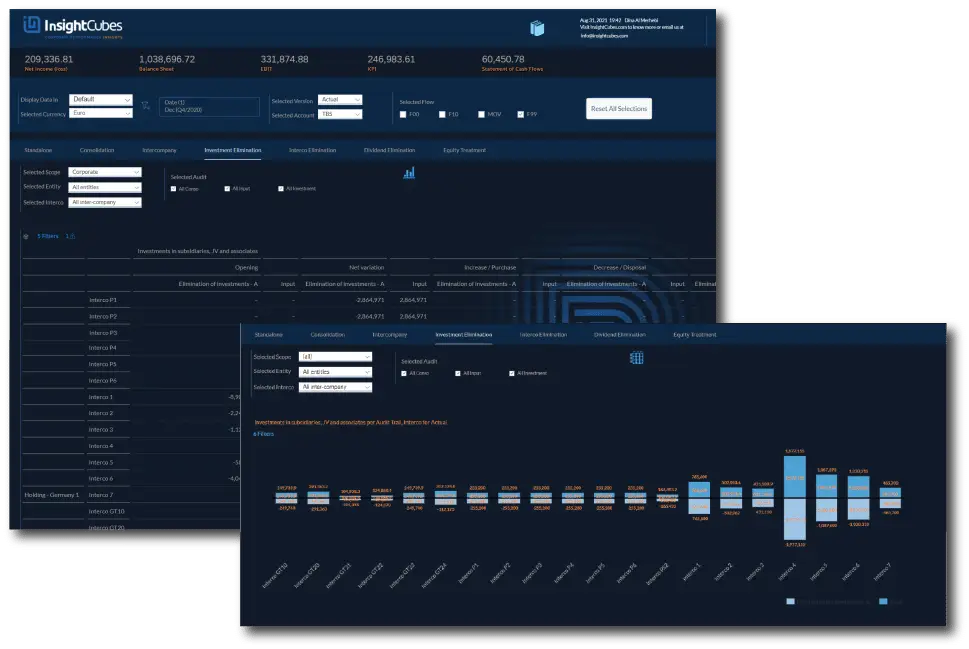
Comprehensive Analytics Application – Investment Elimination
With Investment Elimination, you can report on the standalone, eliminated and total consolidated investment values between holding companies and their subsidiaries and associates.
The Investment Elimination tab is designed to provide the user with report on holding company’s investment in its subsidiaries and associates, along with the eliminations per each.
The user can select the targeted Scope, Entity, Interco, Audit, Version, Account, Date, Flow and Currency. The Report has Entity and Interco in Rows, and Account, Flow and Audit Trail in columns. Account, Audit Trail and Version are set into filters, too.
By clicking on the graph icon, you will be able to see the following graphs:
- Comparison stacked Bar/Column Chart for Investment sin Subsidiaries, JV and Associates per Audit Trail, Interco for Actual
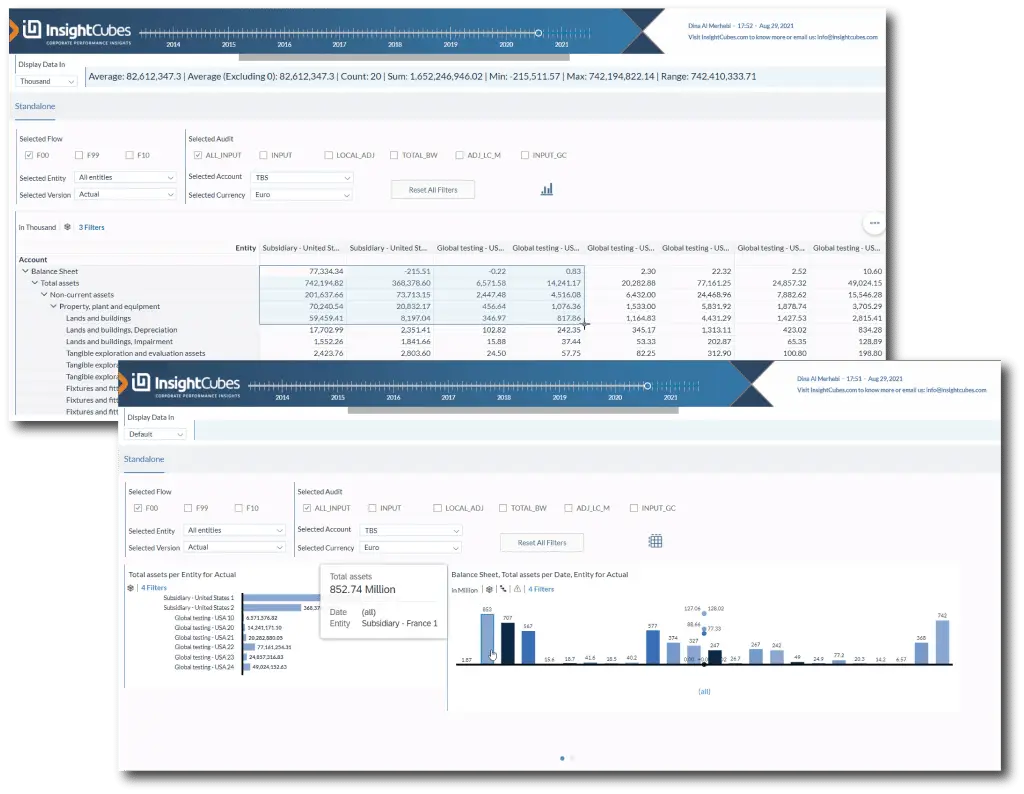
Standalone Analytics Application
The standalone Analytic Application provides all the functionalities to report on any financial statement, based on preconfigured selections
The Standalone Analytics Application allows users to generate Balance sheet, Profit and loss and cashflow reports for a specific Entity or set of entities.
The interface allows selection one of multiple flows, based on the financial statement, and audit trails. Users can also select the Version, Account and Currency.
The reported values can be displayed in full format, thousands or millions. The Report has a fixed structure, whereas Account will be listed in Rows, and entities in columns. The remaining dimensions are part of the filter. Calculated values can be made on the fly upon selection within the table and results will be displayed in a bar up top.
By clicking on the graph icon, you will be able to see the following graphs:
- Comparison Bar/Column chart for Total Assets per Entity for Actual
- Comparison Combination Column & Line chart for Balance Sheet, Total assets per Date, Entity for Actual
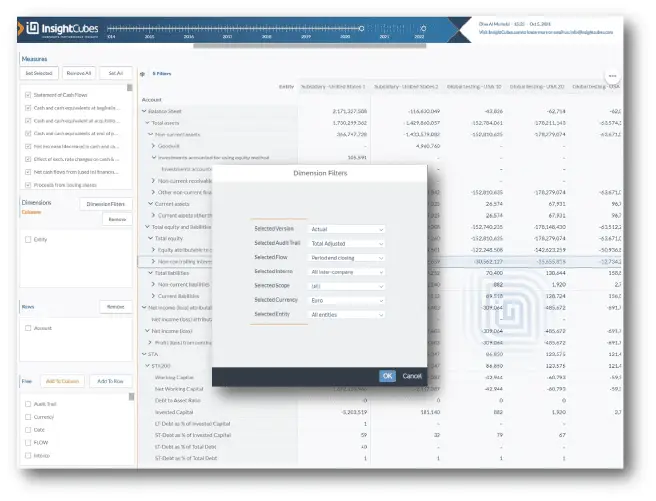
EPM Style Analytics Application
The EPM Style Analytics Application report enables the user to architect the report according to their needs
The EPM Style Analytics Application allows the user to architect the report by determining Dimensions placement in columns or rows.
Filtering specific values for Version, Audit Trail, Flow, Interco, Scope, Currency and Entity Dimensions through a popup, and placing the selection based on the rows/columns desired setting.
The interface allows the selection of one or more dimensions on the rows and columns, enabling end users to generate nested reports without the need to edit reports. Furthermore, users can select multiple measures, based on the required financial result.
More of our SAP BPC solutions:
for inquiries
the SAP BPC reporting pack SAP Analytics Cloud