Eliminate Guesswork
Real Time
Role-based dashboards
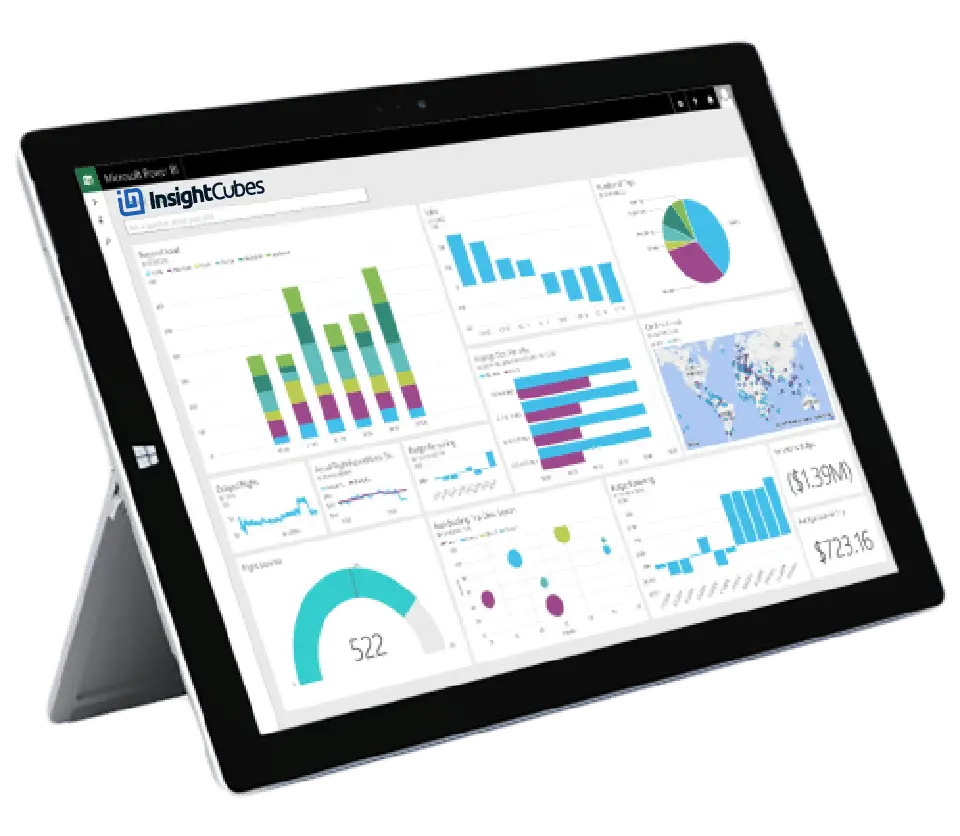
Create interactive, role-based BI dashboards that deliver information to decision makers – anytime, anywhere, on any device.
Customer Insight
Improve Efficiency
Better Understand Costs
Visual Reporting

Mobile Business Intel
Self Service
SAP business intelligence (BI) suite is a flexible and scalable set of solutions that simplify data manipulation, allowing users to access, navigate, analyze, format and share information across a corporate environment.
SAP BI instant Results:
- Faster reporting, analysis or planning.
- More accurate reporting, analysis or planning.
- Better business decisions.
- Improved data quality.
- Improved employee satisfaction.
- Improved operational efficiency.
- Improved customer satisfaction.
- Increased competitive advantage.


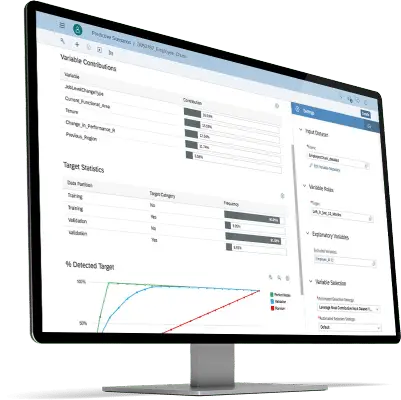
SAP Lumira software is one of the fastest, most engaging ways to get answers from your data – big and small. By letting you pull data directly from enterprise and ad hoc sources and bringing them together in a repeatable way without having to ask for an IT organization’s help, SAP Lumira redefines the notion of self-service information. Point and click data manipulation lets you organize and consolidate data the way you want to: quickly and without a single line of code or an additional modeling layer.
The software’s engaging interface and beautiful visualizations allow you to analyze data quickly to discover unique insights that can help your organization see and respond to changing business conditions. And, with the software’s ability to connect to the SAP HANA platform, businesses get access to real-time answers buried in massive amounts of data.
Roambi was designed and built to deliver the richest experience to data for mobile users. Now you can deliver the same award winning experience to data for all your users, on phones, tablets, and PCs Roambi Delivers:
- Native Applications.
- Instantaneous Performance with NO SPINNERS.
- 100% Offline Functionality for Mobile and PC.
- Beautiful, Integrated Visualizations.
Instead of static dashboards, Roambi Analytics™ is made up of 10 dynamic, integrated visualizations called “views” Each View is a unique combination of interactive navigation, visualization, and analytic features designed to engage and guide you through your data, making it easier to use, and easier to understand.
Give your decision makers an easier way to explore insights and test out future business scenarios. Our dashboard software offers users personalized, drag-and-drop functionality and interactive gauges, charts, and widgets – for instant access to clear, understandable metrics.
Create multi-dimensional dashboards and data visualizations for BI apps on top of SAP NetWeaver BW or SAP HANA data – to put timely, actionable information at your decision makers’ fingertips.
SAP Fiori apps provide a consumer-grade user experience for the most commonly-used scenarios in SAP software. Hundreds of SAP Fiori apps are available across different lines of business and industries covering a wide range from analytical to transactional tasks.
SAP Fiori UX design principles.
Our design concept is based on five core principles that combine to deliver a deeply satisfying user experience:
- Role-based – Deliver the right information at the right time via multi-faceted user interfaces.
- Adaptive – Get instant, relevant insight – whether using mobile apps or a desktop computer.
- Simple – Zero in on your most important tasks, functions, and activities.
- Coherent – Deliver a consistent UX across the enterprise – whether you need to fulfill a sales order, review your latest KPIs, or manage leave requests.
