SAP Analytics Cloud offers the Smart Predict feature, enabling business users to uncover trends and make accurate forecasts using automated machine learning. Its predictive modeling capabilities, including Regression Models, help organizations forecast continuous outcomes such as sales, costs, or demand levels, turning data into actionable insights from the very first analysis. Using SAP’s cloud analytics platform, users can make smarter, data-driven decisions without needing coding expertise.
Building a Regression Model
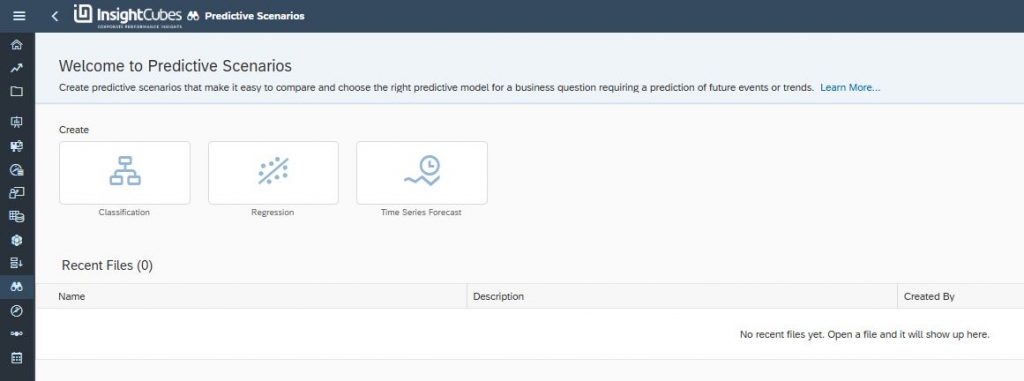
To begin, navigate to the Side Menu → Predictive Scenarios → Regression. Give your scenario a name and description that reflects your business objective
The training dataset contains past observations where the target variable is already known. The Smart Predict feature of SAP Analytics Cloud analyzes this dataset to generate a predictive model that explains and forecasts the target variable based on influencers – the factors that affect it.
When you later apply the model to an application dataset, ensure it has:
- The same structure and number of variables as the training dataset
- Identical variable names (extra columns will be ignored)
Understanding Variable Roles
In SAP’s Analytics Cloud platform, every column in your dataset represents a variable, while each row corresponds to an individual observation.
- Target Variable: The variable you aim to predict (e.g., number of complaints or home price).
- Influencers: Variables that describe and explain the target (e.g., age, income, location).
Excluding Variables
By default, all columns are considered potential influencers. However, you can exclude variables that directly relate to the target or leak information about it (known as leakers). Including such variables can artificially inflate model accuracy.
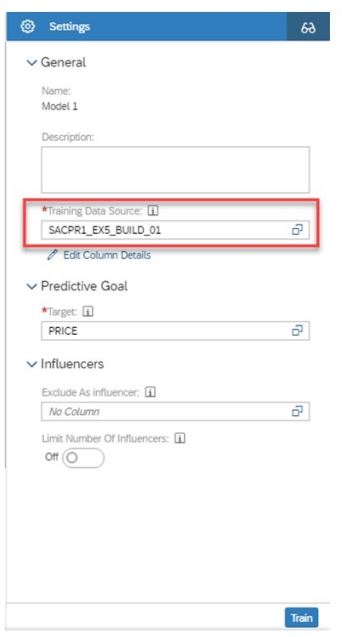
Saving and Training the Model
Once the predictive model setup is complete:
- Save the model – it will appear in your predictive scenario with the status Not Trained.
- Train the model – Smart Predict will analyze variable relationships to find the best combination for prediction
After successful training, the model status updates to Trained. If training fails, check the Status Panel for diagnostic messages
Analyzing Regression Model Results
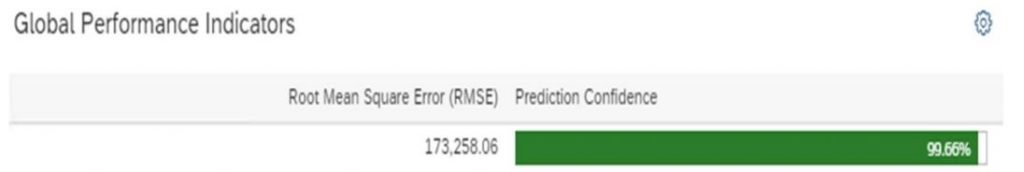
After training, SAC Smart Predict provides several reports to evaluate model performance and interpret results. Root Mean Squared Error (RMSE)
RMSE measures the average difference between predicted and actual values.
- A smaller RMSE indicates a more accurate model.
- RMSE uses the same units as the target variable, making it easy to interpret (e.g., a $200 RMSE means predictions are, on average, $200 off).
You can often reduce RMSE by adding more influencer variables.
Prediction Confidence measures how well your model is expected to perform on new data.
- It ranges from 0% to 100%, and should be as close to 100% as possible.
- You can improve confidence by adding more data rows or refining influencers.
Smart Predict highlights the top five influencers that most impact the target variable.
Influencers are ranked by their contribution, which represents how much each variable explains the target.
The sum of all contributions equals 100%.
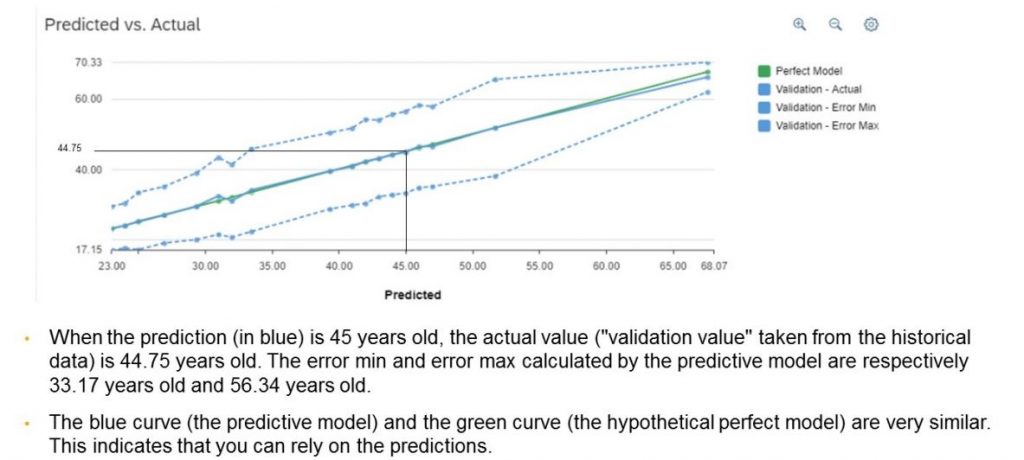
Understanding the Predicted vs Actual Chart
The Predicted vs Actual chart compares your model’s predictions to the actual target values using 20 data segments (bins). You’ll see:
- Validation – Actual curve: Actual target values vs predictions
- Perfect Model curve: Ideal case where predictions match actuals
- Error Min/Max curves: The expected deviation range
How to Interpret the Chart
- Curves don’t match: Model is inaccurate – consider adding more data or influencers.
- Curves match closely: Model is accurate and reliable.
- Curves match except one segment: Model is mostly accurate – retrain with more data for that specific segment.
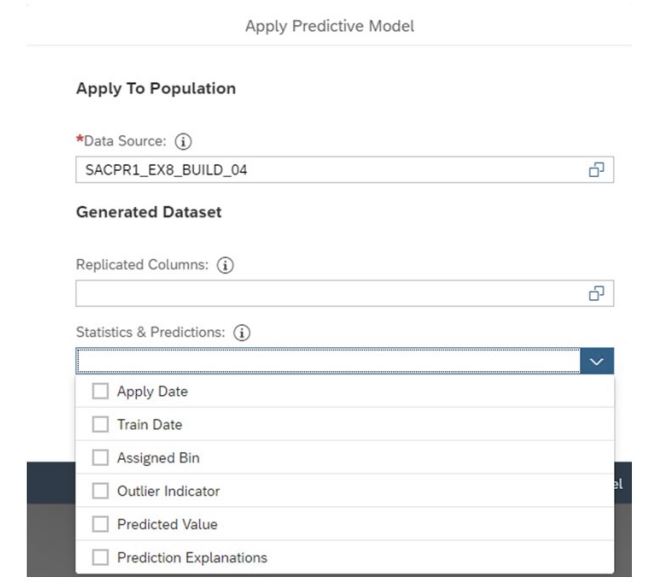
Applying a Regression Model
Once satisfied with your model’s performance, you can apply it to a new dataset to generate predictions. Steps to Apply the Model:
- Open your trained predictive model.
- Choose Apply Predictive Model.
- In the Data Source section, select your new dataset.
- Under Generated Dataset, choose which columns to include in the output (e.g., predictions, statistics).
- Name the output table and click Apply.
The predicted output dataset will appear under Browse → Files. You can open it directly or visualize the results in a BI story.
Additional Output Options
When applying a regression model, you can include extra contextual information in the output dataset.
| Field | Description |
|---|---|
| Apply Date | Start date of the model application (TIMESTAMP) |
| Train Date | Start date of model training (TIMESTAMP) |
| Assigned Bin | Indicates population segment (useful for monitoring data distribution) |
| Outlier Indicator | “1” if the observation is an outlier; “0” otherwise |
| Predicted Value | The predicted numerical outcome |
| Prediction Explanations | Details of variable contributions behind each prediction |
Using Assigned Bins
Bins divide data into approximately 10% segments. If distribution changes significantly (e.g., one bin rises to 14%), it may signal a population shift – time to retrain your model.
Outlier Indicator
Smart Predict flags outliers automatically – cases where prediction error exceeds 3 times the average error.
Prediction Explanations and Strength
Smart Predict can generate up to 10 explanations per prediction, showing the main variables influencing the result. Each explanation includes:
- Variable and Value (e.g., Age = 35)
- Strength: Indicates the magnitude and direction of impact:
- Positive strength → increases predicted value
- Negative strength → decreases predicted value
If more than 10 influencers exist, Smart Predict aggregates the least significant ones into:
- Positive Others
- Negative Others
To visualize regression explanations (e.g., in waterfall charts), SAP Analytics Cloud introduces a baseline pseudo influencer – the mean predicted target. Each final prediction, generated using the Smart Predict feature in SAP Analytics Cloud, equals the baseline plus contributions from all other influencers, making regression explanations clear and easy to interpret within SAP’s cloud analytics platform.
Improving and Managing Models
After evaluating results, you can:
- Use the model if performance is satisfactory.
- Improve it by duplicating and retraining with new settings or more data.
To duplicate:
- Open the predictive scenario
- Go to the model list → Click … → Duplicate
- Retrain or modify the copy to compare results.
Conclusion
Regression modeling with Smart Predict in SAC turns historical data into actionable insights without coding. By analyzing key variables, evaluating model accuracy, and interpreting Influencer Contributions, organizations can make smarter, data-driven decisions and unlock real business value using this cloud-based analytics solution.
Key Takeaways
- RMSE measures accuracy – lower is better.
- Prediction Confidence shows reliability – closer to 100% is ideal.
- Influencer analysis reveals what drives outcomes.
- Assigned bins and outlier indicators help monitor data shifts.
- Prediction explanations make models transparent and explainable.