Some of the functionalities InsightCubes used for ease of navigation, filtering, and best use of space in dashboards.
In this blog post you will find the following technical functionalities:
- Expand and Collapse filters
- Switch Table/Chart View
- Library Popup
Read on to learn exactly how to expand and collapse filters, switch to the table/chart view, and use the Library Popup.
1. Expand/Collapse global filter pane

In Figure 1.1, the collapsed Global Filter Pane makes the animation bar, logo, and dynamic text widget visible.
A filter button appears on the far right of the screen. When the user clicks it, the global filter pane expands upward, hiding the top section, and downward, pushing the tab strip to its designated pixel position. At the same time, the button switches to the Close Global Filter Pane icon.
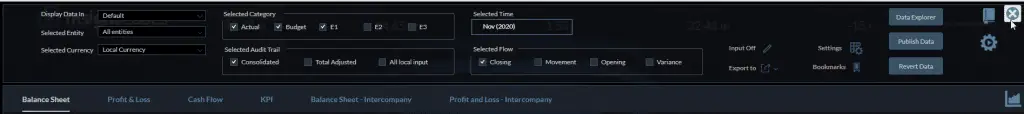
When expanded, the Global filter sets all filtering widgets to visible.
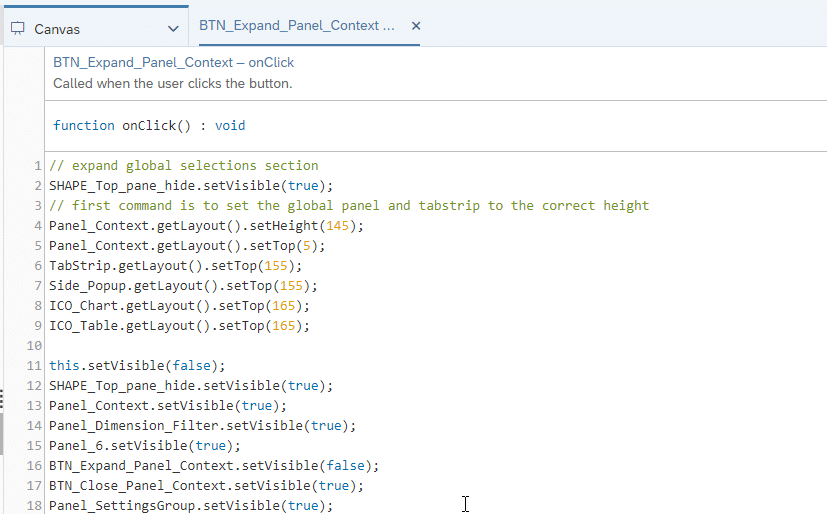
     // expand global selections section
     SHAPE_Top_pane_hide.setVisible(true);
     // first command is to set the global panel and tabstrip to the correct height
     Panel_Context.getLayout().setHeight(145);
     Panel_Context.getLayout().setTop(5);
     TabStrip.getLayout().setTop(155);
     Side_Popup.getLayout().setTop(155);
     ICO_Chart.getLayout().setTop(165);
     ICO_Table.getLayout().setTop(165);

     this.setVisible(false);
     SHAPE_Top_pane_hide.setVisible(true);
     Panel_Context.setVisible(true);
     Panel_Dimension_Filter.setVisible(true);
     Panel_6.setVisible(true);
     BTN_Expand_Panel_Context.setVisible(false);
     BTN_Close_Panel_Context.setVisible(true);
     Panel_SettingsGroup.setVisible(true);
2. Switch to Table/Chart view
At runtime, the dashboard displays reports (tables). Therefore, we set the chart icon to visible and the table icon to invisible during initialization. This setting will change upon click, and reverse the visibility according to which view is showing from the last click.
You can place the icons on the tab strip to keep them visible at all times and make effective use of the available static space on the dashboard.

On run time, our dashboard is set to show the reports (tables), so we have the Chart icon set to visible and the table icon set to invisible on initialization. This setting will change upon click, and reverse the visibility according to which view is showing from the last click.
The icons can be placed on the Tab Strip to have them visible at all times, and help make use of any static space available on the dashboard.
    // sets charts and radio buttons in all tabs to visible, and hides tables and chart icon

    ////////////////Icons
    ICO_Table.setVisible(true);
    ICO_Chart.setVisible(false);

    ////////////////BS Tab
    BS_Chart_1.setVisible(true);
    BS_Chart_2.setVisible(true);
    BS_Chart_3.setVisible(true);
    RB_BS_Acct.setVisible(true);

    BS_Table.setVisible(false);

    ////////////////PL Tab
    PL_Chart_1.setVisible(true);
    PL_Chart_2.setVisible(true);
    PL_Chart_3.setVisible(true);

    RB_PL_Acct.setVisible(true);

    PL_Table.setVisible(false);

    ////////Icons
    //makes chart icon visible and hides table icon
    ICO_Table.setVisible(false);
    ICO_Chart.setVisible(true);

    //everything below this line is to set tables in all tabs to visible and hides all charts and radio buttons

    ////////////BS Tab
    BS_Chart_1.setVisible(false);
    BS_Chart_2.setVisible(false);
    BS_Chart_3.setVisible(false);
    RB_BS_Acct.setVisible(false);

    BS_Table.setVisible(true);

    ///////////PL Tab
    PL_Chart_1.setVisible(false);
    PL_Chart_2.setVisible(false);
    PL_Chart_3.setVisible(false);
    RB_PL_Acct.setVisible(false);

    PL_Table.setVisible(true);
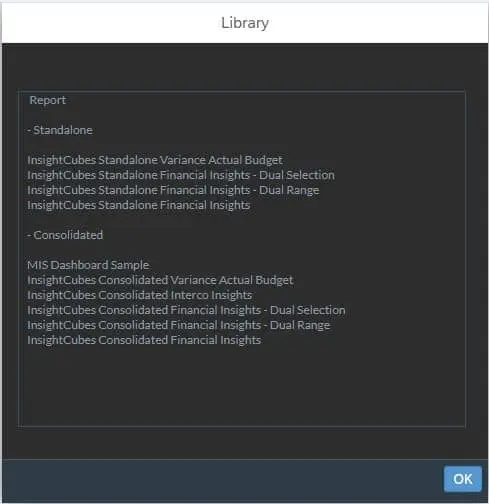
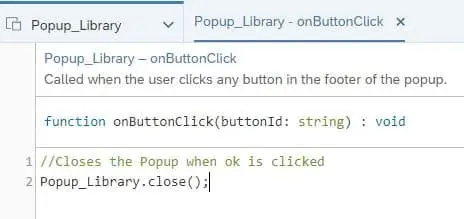
3. Library Popup
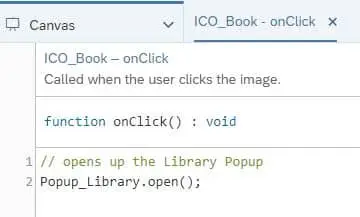
On click of the Library icon, the library popup appears
Find more helpful SAP Analytics Designer How-tos on our SAP Analytics blog.