When working with planning and forecasting using the SAP Analytics Cloud Excel Add-in, a frequent challenge is managing Actuals and Forecast data together without breaking formulas or requiring constant manual updates.
Previously, in our blog SAC Excel Add-in Rolling Forecast, we described how to build rolling forecasts using the SAC Excel Add-in, focusing on dynamic date selection and version filtering.
Based on further practical experience, this article presents a more optimized report structure that reduces manual adjustments and improves Excel formula stability.
Why Asymmetrical Filters Matter in SAP Analytics Cloud Excel Add-in Forecasting
In real planning scenarios, Actual and Forecast data rarely cover the same time range:
- Actuals stop at the last closed period.
- Forecasts begin in the next open period.
Trying to manage this with a single symmetrical filter often leads to:
- Overwritten formulas
- Manual reassignments every month
- Hard-to-read logic
- Higher maintenance effort
By contrast, asymmetrical filters in the SAP Analytics Cloud Excel Add-in allow each version block to have its own tailored date set, making forecasting tables clean, predictable, and formula-friendly.
The Block-Based Design Explained
The optimized approach structures the table into two dedicated blocks:
- Actual Block – contains only historical months up to the Assigned Date.
- Forecast Block – contains only future periods beyond the Assigned Date.
This ensures:
- No overlap between Actuals and Forecast
- Fixed column positions
- Excel formulas remain intact and never require rewriting
Implementation Steps
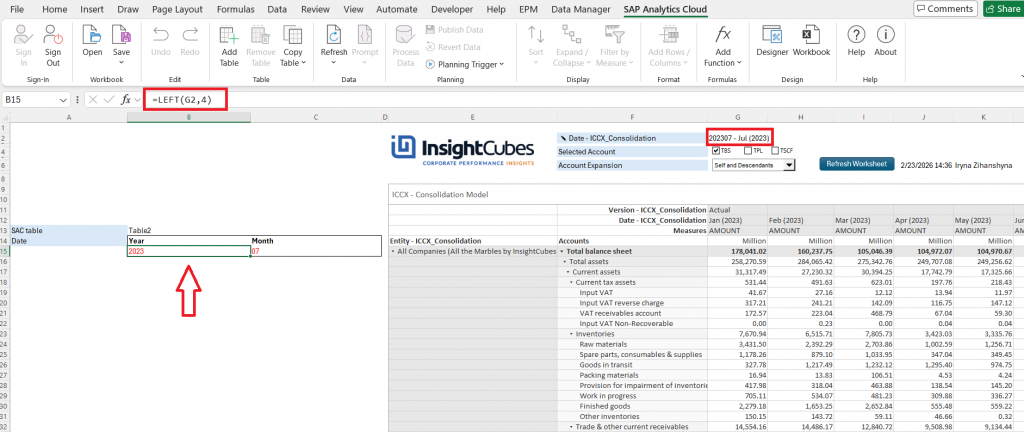
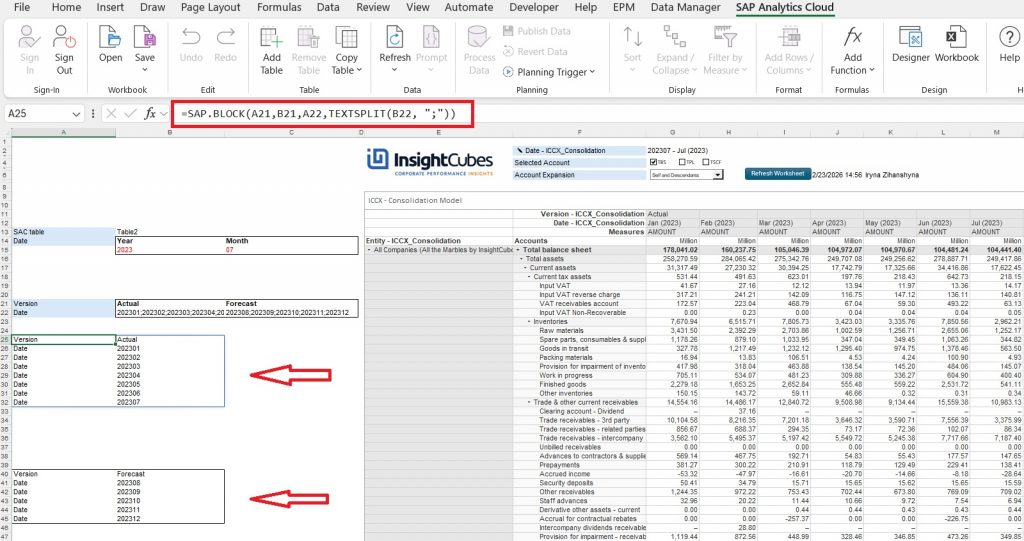
Split the Date into Year and Month rows – makes filtering and logic easier.
Define a Version column – distinguish between Actual and Forecast.
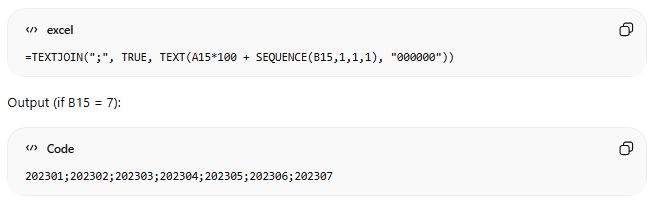
Apply dynamic formulas for date logic – assign each month to the correct data category:
The first formula handles months before or equal to the cutoff.
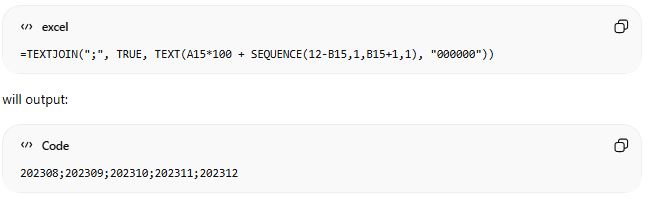
The second formula handles months after the cutoff through December.
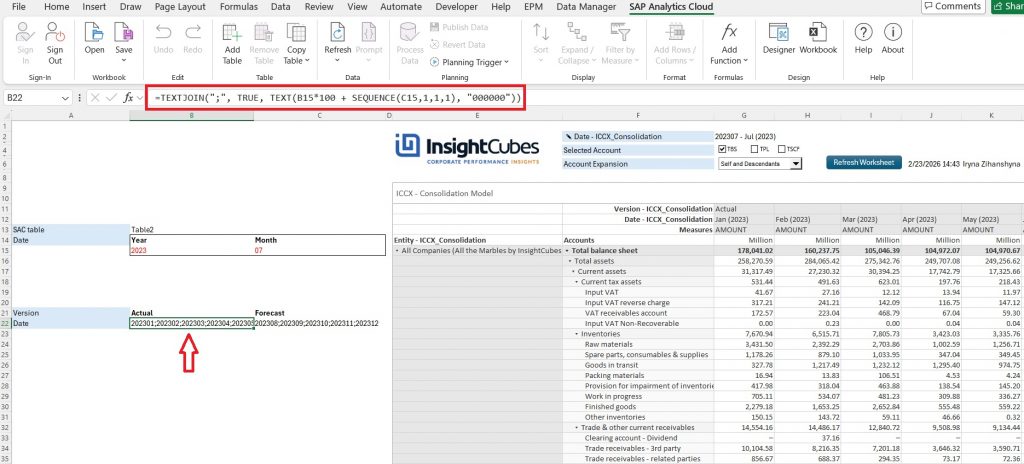
Create separate blocks based on the Actual and Forecast selection.
Assign blocks to the report table – ensures stable layout and formula integrity.
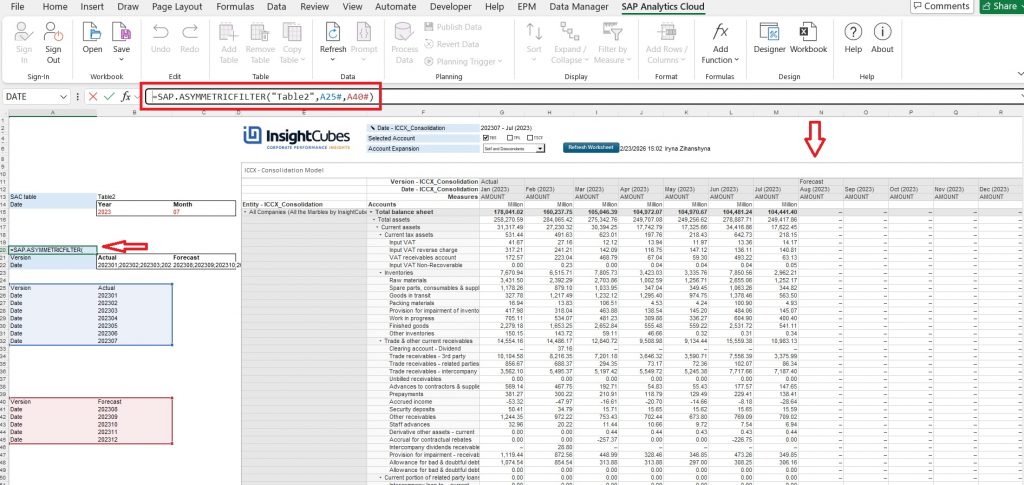
Why Leaving Space on the Left Side Is Critical
A common pain point is losing formula stability when columns shift due to filters. In the previous blog, we showed how dynamic date selection enhances rolling forecasts – but without reserved space, formulas often broke as time periods changed.
In this optimized design, we intentionally reserve space on the left side so that:
- Users can insert Excel formulas
- Calculations reference fixed cell ranges
- Notes, variance logic, and helper columns remain intact
- The table stays formula-friendly even after data refresh
This simple design consideration is highly effective -especially for finance professionals relying on Excel logic alongside SAC data
Benefits of the Optimized Approach
- Fixed structure – report layout doesn’t shift monthly
- Formula stability – no rewriting required
- Clear Actual vs Forecast separation
- Simplified maintenance
- Improved readability and usability
- Scalable – easily extends to future years or rolling periods
Most importantly, this method aligns with how planners and analysts think: past data stays static, future projections change, and the layout supports both without confusion.
Final Thoughts
While our previous blog introduced the concept of a rolling forecast, this optimized approach takes it further by providing:
- Excel-friendly layouts
- Stable time filters
- Independent blocks for version control
The result is a robust, flexible, and user-friendly report in the SAP Analytics Cloud Excell Add-in, making it easier for end users to write formulas, compare Actuals vs Forecast, and maintain the model over time.