Introduction
In the era of data-driven decision-making, organizations need tools that make analytics smarter and more intuitive. Consequently, SAP Analytics Cloud delivers exactly that through its Smart Features – AI-powered capabilities designed to simplify data exploration, automate insights, and enhance predictive accuracy.
As a result, these Smart Features help organizations analyze past performance, understand key drivers behind KPIs, and forecast future outcomes, turning complex data into actionable intelligence.
Smart Assist: Simplify Data Exploration
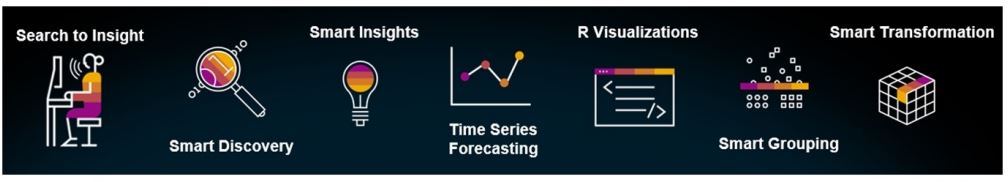
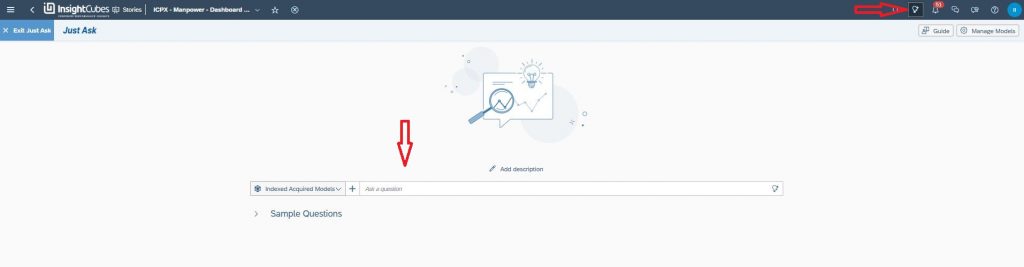
1. Search to Insight
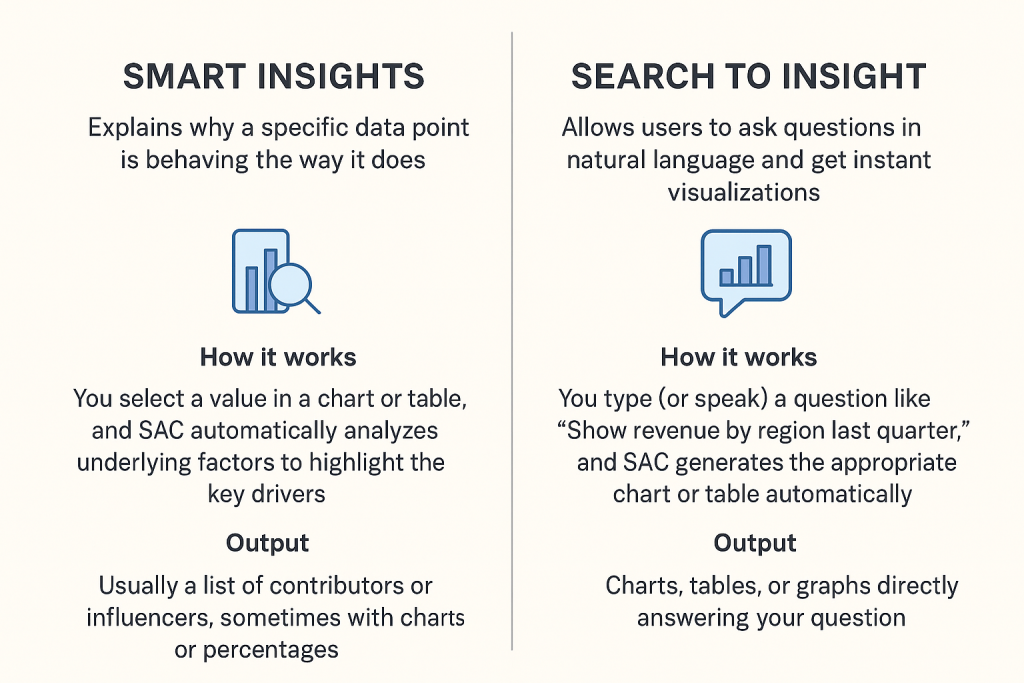
Data questions can be asked in natural language, and SAC provides instant visual answers. For instance, by using Natural Language Processing (NLP), Search to Insight converts your queries into charts or tables automatically.
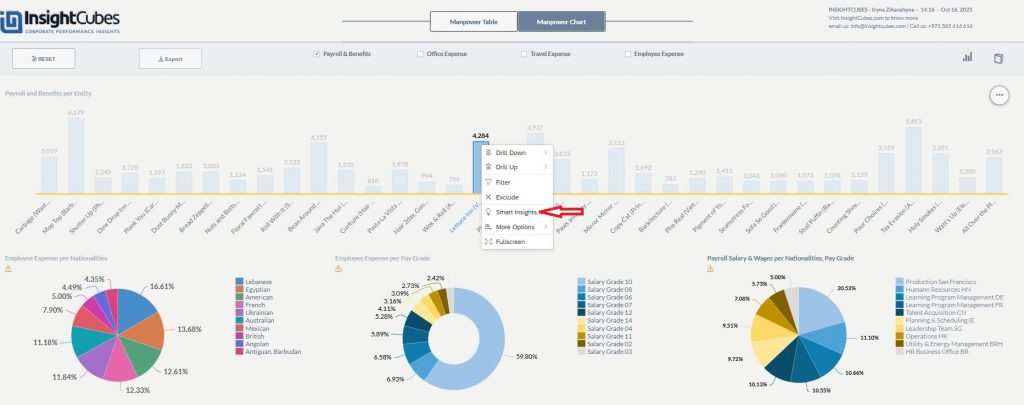
2. Smart Insights
Smart Insights provides contextual explanations with a single click. In addition, SAC automatically identifies key drivers behind changes in your data and visualizes the results in your story
Purpose: Help users understand why specific data points behave the way they do.
How it works: By selecting a value in a chart or table, SAC highlights the most influential factors automatically.
Note: Smart Insights explains why something happened, while Search to Insight shows what is happening in your data.
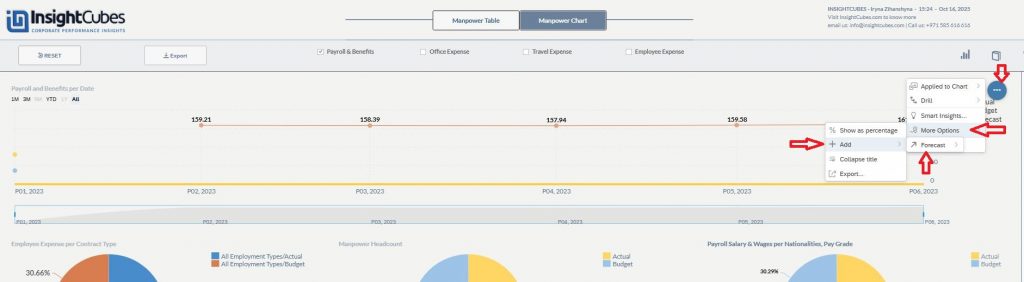
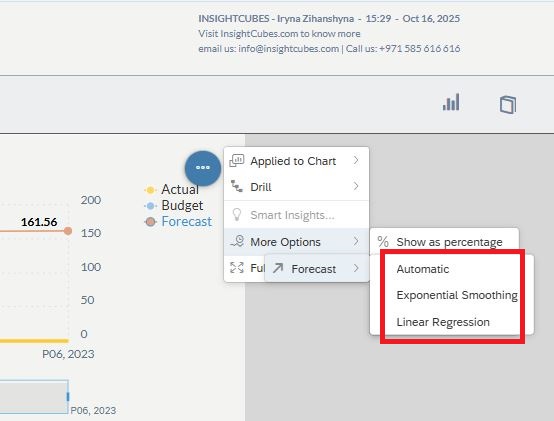
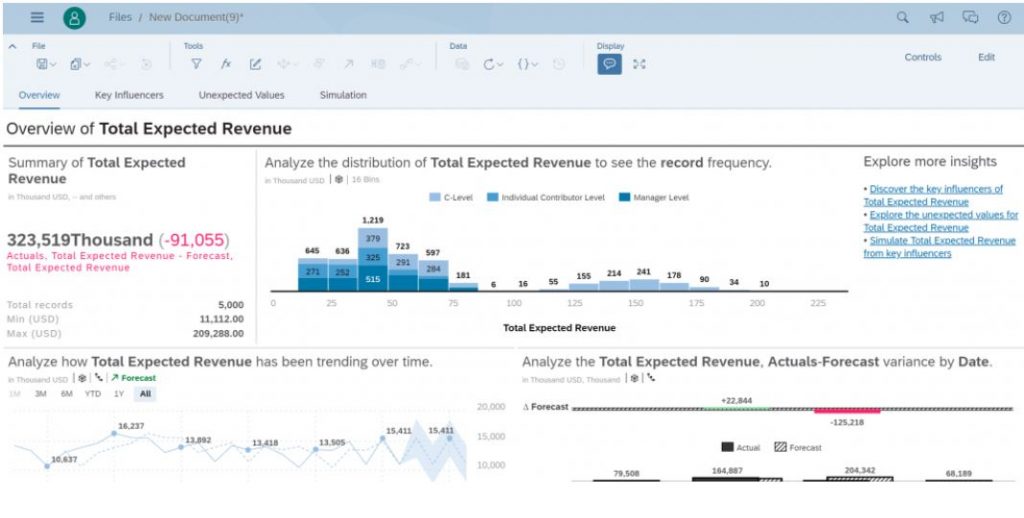
3. Time Series Forecasting
Time Series Forecasting helps organizations anticipate future trends by leveraging historical data and predictive models. Consequently, it enables more accurate planning and decision-making with forward-looking insights.
Purpose: Predict upcoming trends based on historical data.
How it works: SAC analyzes historical data to generate forecasts. Users can:
- Add forecasts using automatic forecasting, linear regression, or triple exponential smoothing.
- Assess forecast quality with visual confidence intervals.
- Simulate “what-if” scenarios to explore potential outcomes.
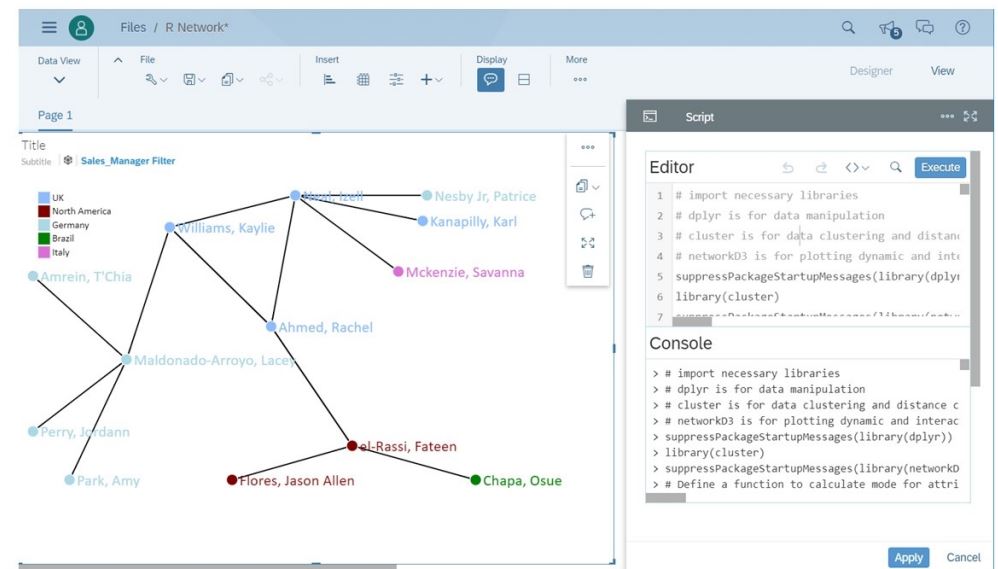
4. R Visualizations
By integrating R, SAC enables advanced users and data scientists to perform sophisticated statistical analysis and build predictive models directly within dashboards and stories. Consequently, this approach allows deeper insights and highly customized visualizations.
Purpose: Enhance dashboards with statistical and predictive visualizations for better understanding of your data.
How it works:
- SAC includes a built-in R server that executes scripts securely.
- Leverage advanced algorithms and statistical functions not natively available in SAC.
- Visualize complex relationships between variables using custom plots and charts.
- Embed interactive and dynamic visuals within SAC stories.
- Integrate machine learning models using R packages to generate predictive analytics.
- Connect seamlessly to SAC models or data sources, refreshing automatically when data updates.
Benefits:
- Extend SAC beyond standard charting and forecasting.
- Combine machine learning with visual storytelling.
- Support custom analytics logic tailored to unique business needs.
- Foster collaboration between data scientists and business users.
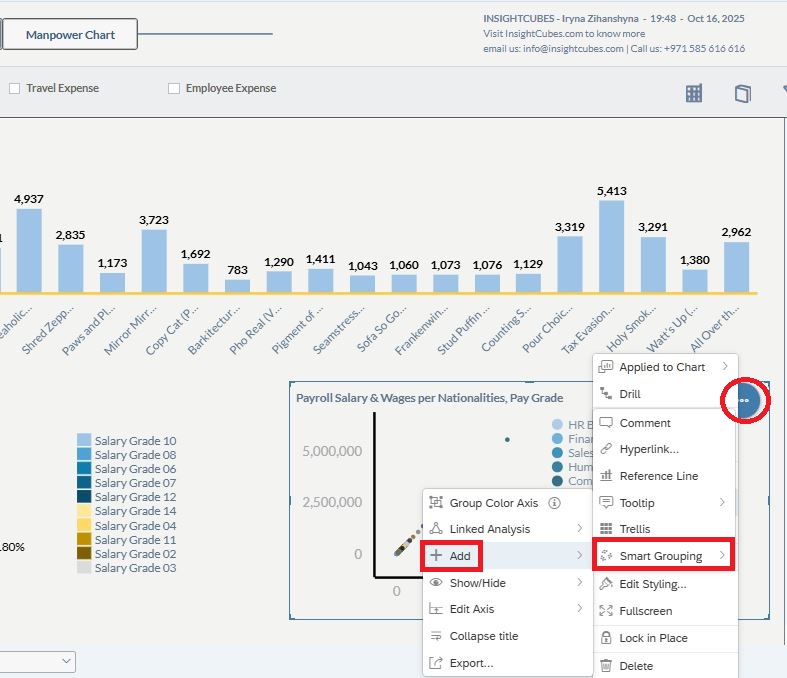
5. Smart Grouping
The Smart Grouping feature automatically clusters data into meaningful groups, thereby helping users spot patterns that might otherwise go unnoticed.
Purpose: Identify natural groupings in your data to reveal trends, segments, or clusters that support better decision-making.
How it works: The clustering highlights patterns, and groups update automatically as data changes.
Check that your SAC license includes smart features and your data model supports clustering.
6. Smart Discovery
Smart Discovery uncovers hidden insights quickly by analyzing data and highlighting key patterns. In addition, it accelerates data exploration and supports informed decision-making.. This feature accelerates data exploration and supports informed decision-making.
Purpose: Reveal important drivers, correlations, and outliers in your data to understand what influences business outcomes.
How it Works: SAC automatically analyzes your dataset, identifies key influencers and patterns, and generates interactive visualizations. Users can also simulate “what-if” scenarios to explore potential outcomes of strategic changes.
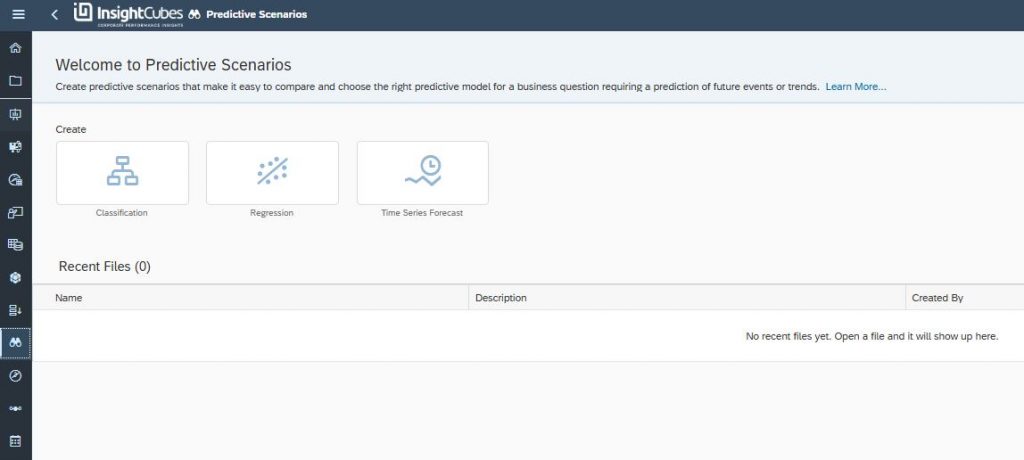
Unlock Data-Driven Decisions with Smart Predict
Smart Predict brings automated machine learning to business users, enabling predictive insights without requiring data science expertise. Consequently, this tool helps organizations make data-driven decisions by forecasting outcomes and identifying patterns
Purpose: Generate predictive insights and forecasts to anticipate trends, behaviors, and outcomes, supporting smarter planning and decision-making.
How it works:
- Classification: Identify categories or behaviors within your data.
- Regression: Predict numerical outcomes.
- Time Series Forecasting: Project future values over time.
Smart Predict integrates with SAP HANA and SAC planning, ensuring that predictive results update automatically as new data becomes available.
Predictive Analytics Made Accessible for Business Analysts
Smart Predict empowers business analysts, making predictive analytics accessible without requiring deep technical knowledge.
- Focus on business outcomes: Capture user intent – “what do you want to predict?” – instead of focusing on technical details.
- Transparent predictions: Each prediction comes with accuracy metrics and key influencers, enabling trustworthy decisions.
From BI to Augmented BI:
- Embed predictions and forecasts directly in SAC stories and planning models.
- Stories update automatically as predictions evolve.
- Schedule automated updates to run against the latest data.
Interaction with SAP data frameworks:
- Import data from SAC models or use live connections to SAP HANA.
- Generate predictions and insights directly in SAC for immediate analysis.
Main predictive techniques:
- Classification – Predict customer behavior, risk of churn, or propensity to buy.
- Regression – Estimate numeric values and identify key influencers.
- Time Series Forecasting – Generate forecasts for each dimension, such as sales per region or travel expenses per department
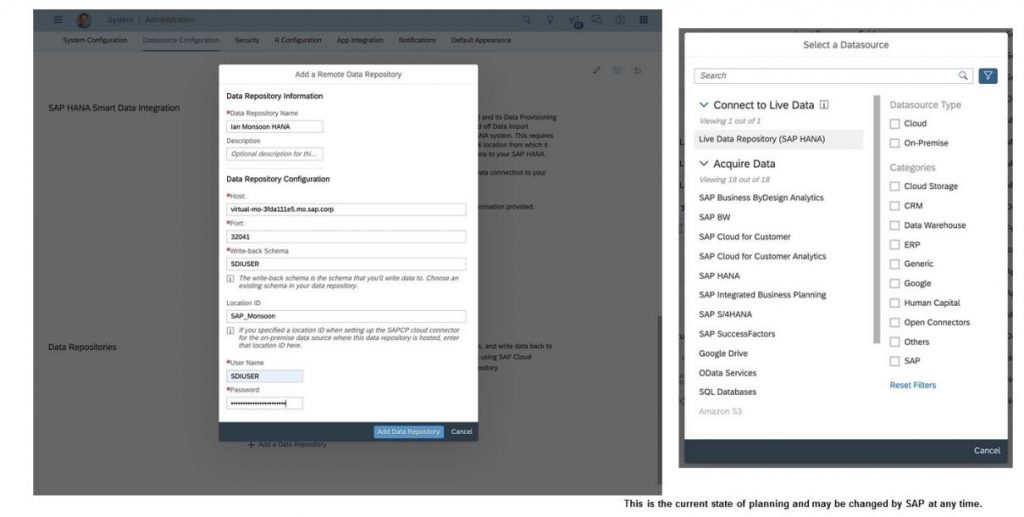
Live Smart Predict with SAP HANA
For organizations using SAP HANA, Live Smart Predict delivers real-time predictive analytics directly within the HANA environment. Therefore, there is no need to extract or replicate data.
Key benefits include:
- Real-time predictions that update automatically as HANA data changes.
- Seamless integration with live connections to HANA, instantly refreshing SAC stories.
- End-to-end planning: predictive forecasts can be re-integrated into SAC Planning for bottom-up forecasting.
From Business Intelligence to Augmented Analytics
Smart Features transform traditional BI into Augmented Analytics, thus merging human intuition with machine intelligence. This empowers users to:
- Generate forecasts and predictions directly within stories.
- Schedule automatic updates as data changes.
- Build transparency with clear accuracy metrics and influencer insights.
Conclusion
SAP Analytics Cloud Smart Features – from Smart Assist to Smart Predict, Live Smart Predict, and R Visualizations – redefine how organizations explore and forecast data.
Overall, by combining automation, natural language processing, and machine learning, SAC makes advanced analytics accessible to everyone. This enables smarter, faster, and more confident business decisions.