InsightCubes’ SAP Analytics Cloud Consolidation Landing Page Dashboard is a navigational menu designed to provide easy access to all the Cloud Consolidation extension stories and analytic applications in one interface.
The home page consists of links to all the SAP Cloud Consolidation components, from Data Action Triggers, Stories, and Analytic Applications in a sequential manner, that starts from data import and preparation, ending with consolidation and data locking.
The Landing Page is an all-in-one interface, designed to provide full visibility and control over the end-to-end consolidation process.
Cloud Consolidation Extension – Data Import
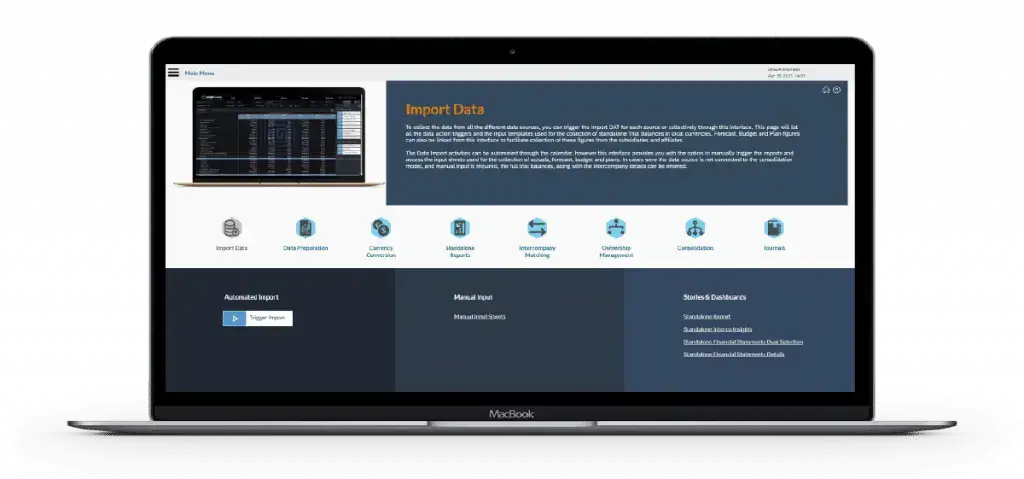
To collect the data from all the different data sources, you can trigger the Import DAT for each source or collectively through this interface. This page will list all the data action triggers and the input templates used for the collection of standalone Trial Balances in local currencies. Forecast, Budget, and Plan figures can also be linked from this interface to facilitate the collection of these figures from the subsidiaries and affiliates.
The Data Import activities can be automated through the calendar, however, this interface provides you with the option to manually trigger the imports and access the input sheets used for the collection of actuals, forecast, budget, and plans. In cases where the data source is not connected to the consolidation model and manual input is required, the full trial balances, along with the intercompany details can be entered.
Cloud Consolidation Extension – Data Preparation
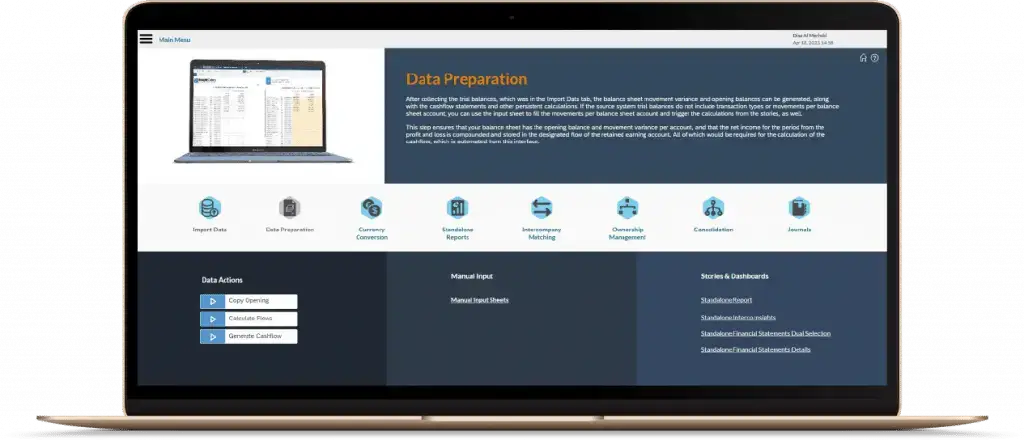
After collecting the trial balances, which was in the Import Data tab, the balance sheet movement variance and opening balances can be generated, along with the cashflow statements and other persistent calculations. If the source system trial balances do not include transaction types or movements per balance sheet account, you can use the input sheet to fill the movements per balance sheet account and trigger the calculations from the stories, as well.
This step ensures that your balance sheet has the opening balance and movement variance per account, and that the net income for the period from the profit and loss is compounded and stored in the designated flow of the retained earning account. All of these would be required for the calculation of the cash flow, which is automated from this interface.
Currency Conversion
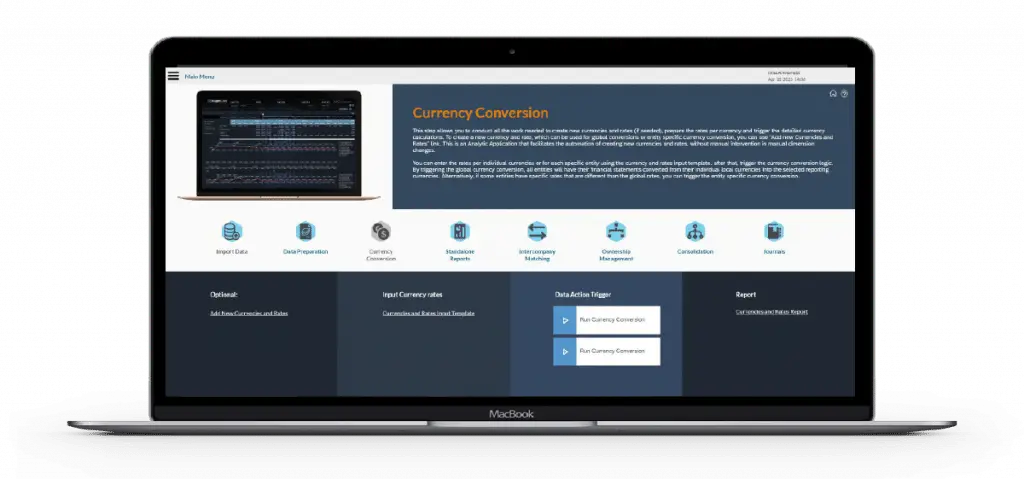
This step allows you to conduct all the work needed to create new currencies and rates (if needed), prepare the rates per currency and trigger the detailed currency calculations. To create a new currency and rate, which can be used for global conversions or entity-specific currency conversion, you can use the “Add new Currencies and Rates” link.
This is an Analytic Application that facilitates the automation of creating new currencies and rates, without manual intervention in manual dimension changes.
You can enter the rates per individual currencies or for each specific entity using the currency and rates input template. after that, trigger the currency conversion logic.
By triggering the global currency conversion, all entities will have their financial statements converted from their individual local currencies into the selected reporting currencies. Alternatively, if some entities have specific rates that are different than the global rates, you can trigger the entity-specific currency conversion.
Standalone Reports
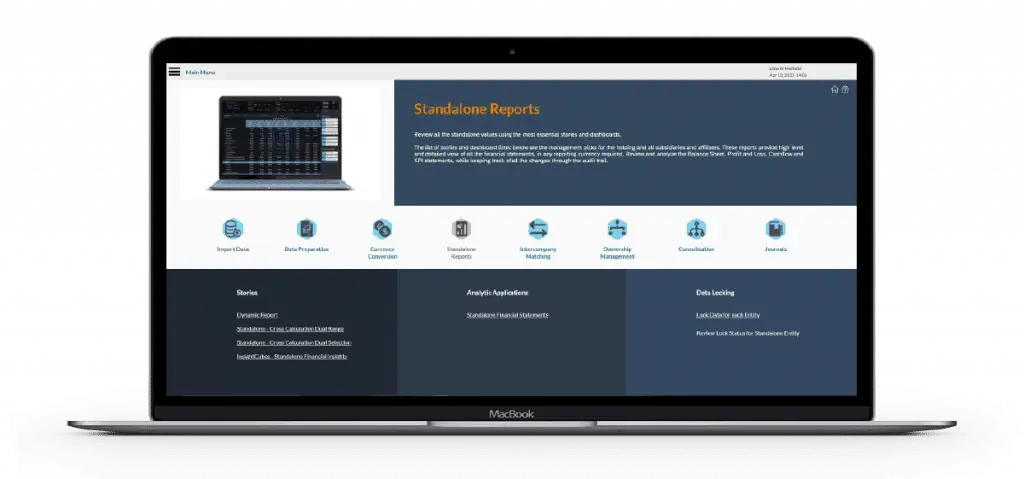
Review all the standalone values using the most essential stories and dashboards.
The list of stories and dashboard listed below are the management picks for the holding and all subsidiaries and affiliates. These reports provide a high-level and detailed view of all the financial statements, in any reporting currency required.
Review and analyze the Balance Sheet, Profit and Loss, Cashflow, and KPI statements, while keeping track of all the changes through the audit trail.
Intercompany Matching
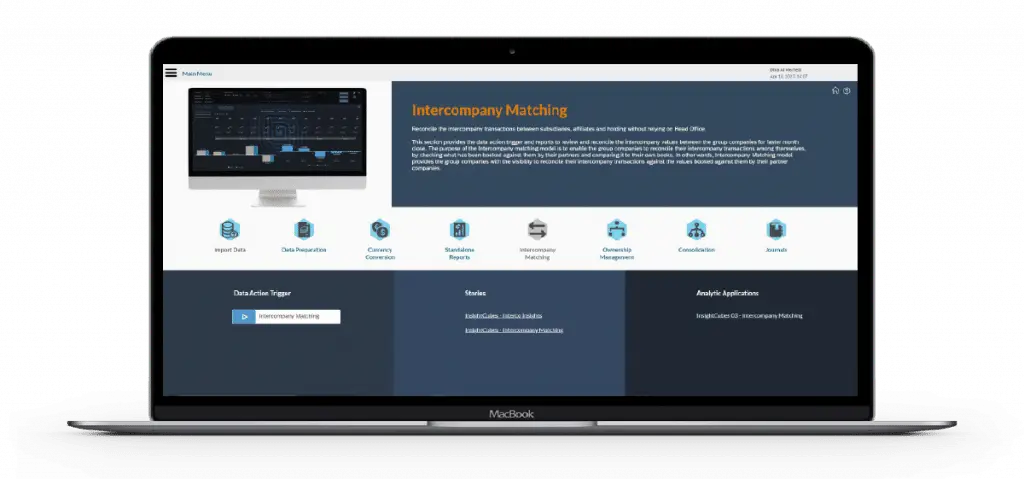
Reconcile the intercompany transactions between subsidiaries, affiliates, and holding without relying on Head Office.
This section provides the data action trigger and reports to review and reconcile the intercompany values between the group companies for faster month close. The purpose of the Intercompany matching model is to enable the group companies to reconcile their intercompany transactions among themselves, by checking what has been booked against them by their partners and comparing it to their own books.
In other words, the Intercompany Matching model provides the group companies with the visibility to reconcile their intercompany transactions against the values booked against them by their partner companies.
Ownership Management
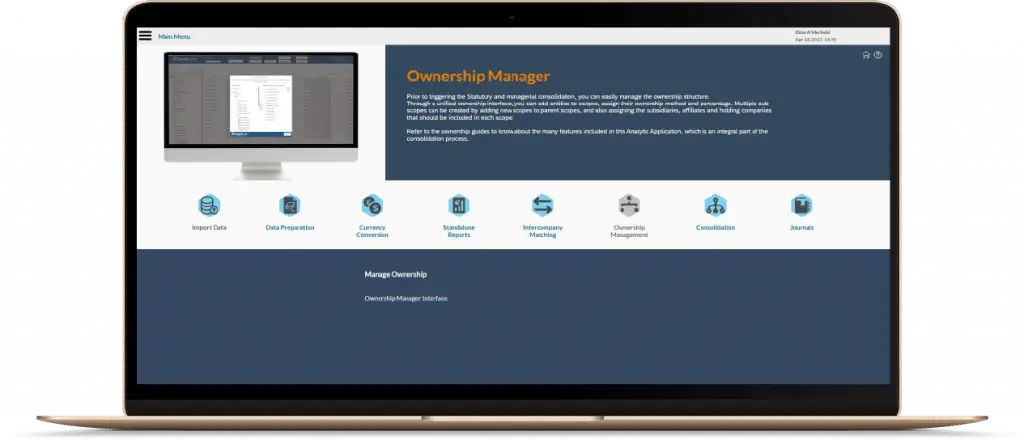
Prior to triggering the Statutory and managerial consolidation, you can easily manage the ownership structure.
Through a unified ownership interface, you can add entities to scopes. Then, you can assign their ownership method and percentage. Multiple sub-scopes can be created by adding new scopes to parent scopes. Assigning the subsidiaries, affiliates, and holding companies that should be included in each scope.
Refer to the ownership guides to know about the many features included in this Analytic Application, which is an integral part of the consolidation process.
Consolidation
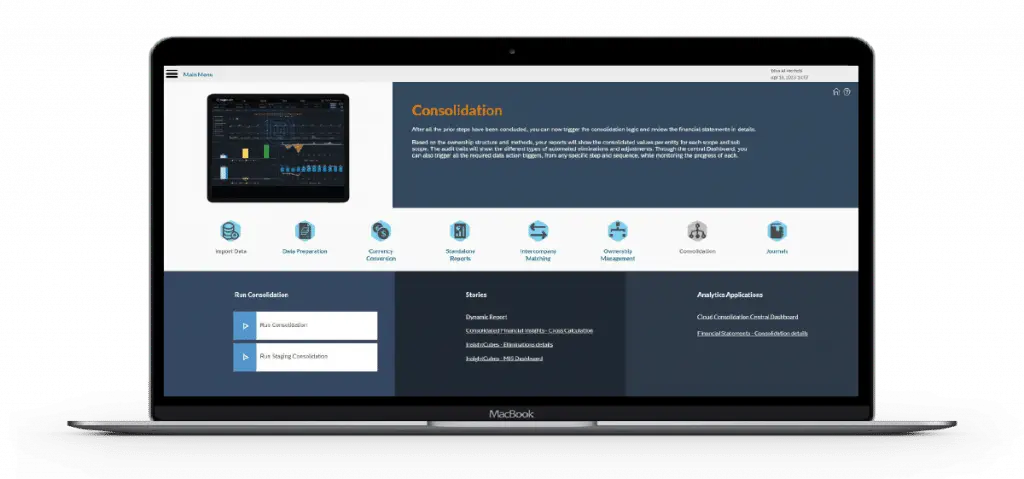
After all the prior steps have been concluded, you can now trigger the consolidation logic and review the financial statements in detail.
Based on the ownership structure and methods, your reports will show the consolidated values per entity for each scope and sub-scope. The audit trails will show the different types of automated eliminations and adjustments. Through the central Dashboard, you can also trigger all the required data action triggers, from any specific step and sequence, while monitoring the progress of each.
Journals
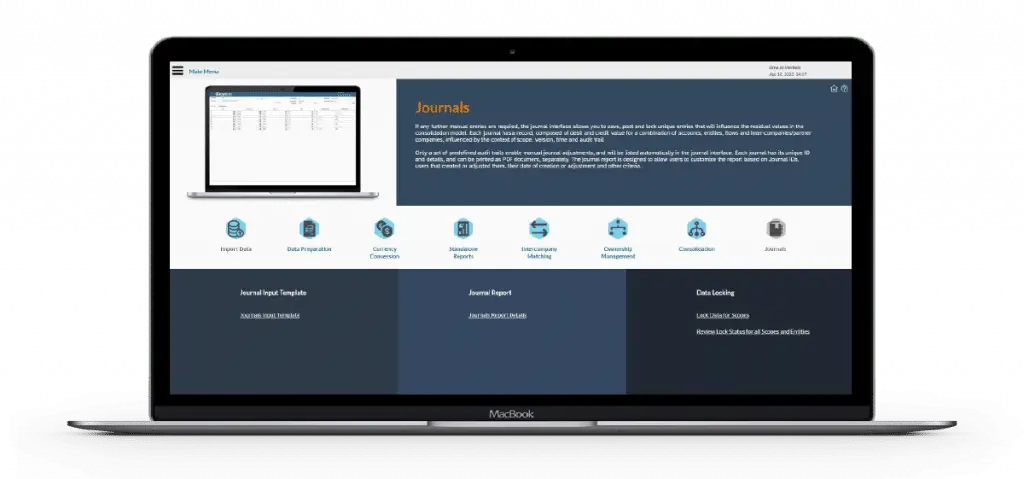
If any further manual entries are required, the journal interface allows you to save, post and lock unique entries that will influence the residual values in the consolidation model. Each journal has a record, composed of debit and credit value for a combination of accounts, entities, flows and inter-companies/partner companies, influenced by the context of scope, version, time and audit trail.
Only a set of predefined audit trails enable manual journal adjustments, and will be listed automatically in the journal interface. Each journal has its unique ID and details, and can be printed as PDF document, separately. The journal report is designed to allow users to customize the report based on Journal IDs, users that created or adjusted them, their date of creation or adjustment and other criteria.
Landing Page Menu
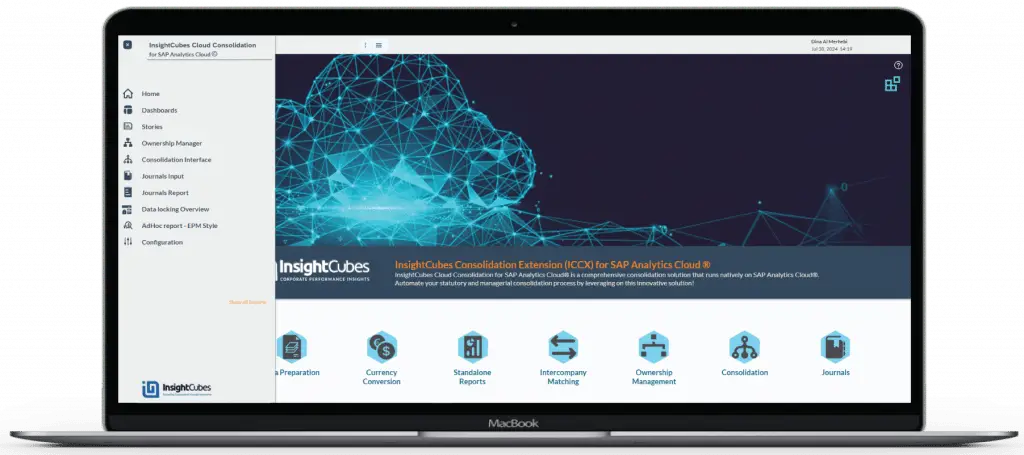
While the Home page offers a comprehensive overview and documentation of InsightCubes’ Cloud Consolidation Extension steps and lists their Data Action Triggers, Stories, and Analytic Applications allowing the user to navigate to a specific component, the Menu allows the user to navigate to a customizable list of Stories, Analytic Applications that allow reporting on financial statements, Data Action status, EPM Style ad-hoc reports, Journal reports, and other “favorite” interfaces.
