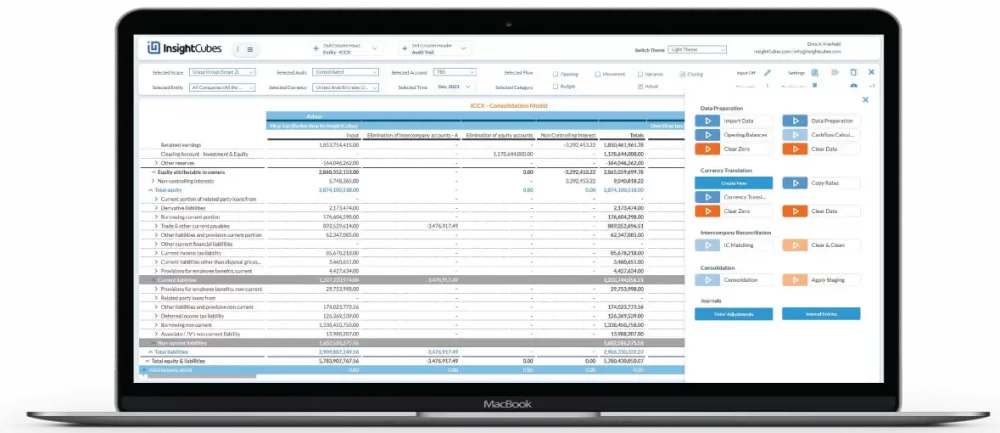
Switch Themes in SAP Analytics Cloud
By leveraging the power of Theme Builder and integrating JavaScript and CSS, users can seamlessly tailor their dashboards’ appearance to align with specific brand guidelines and aesthetic preferences.
✆ UAE: +971 58 5616 616, ✆ USA:+14099168409, ✉ info@insightcubes.com
By leveraging the power of Theme Builder and integrating JavaScript and CSS, users can seamlessly tailor their dashboards’ appearance to align with specific brand guidelines and aesthetic preferences.
What is Extended Planning and Analysis (xP&A)? Briefing: The Extended Planning and Analysis is a prepackaged content for SAP Analytics Cloud designed to establish a simplified, comprehensive planning process by bringing together financial, supply chain, and workforce planning. By creating one connected plan across lines of business, they can strengthen
SAP Analytics Cloud Calendar Features and API’s Workflow Organization (Calendar) Use the SAP Analytics Cloud calendar to organize your workflows with calendar events: You can create different types of tasks and assign people to work on them and others to review the work. You can use processes to manage multiple
Live connection (Online) and Import connection (batch) with SAP Analytics Cloud SAP Analytics Cloud enables access to on-premise and cloud data sources using two main connection types: Live connection (Online) and Import connection (batch). Both access data from a variety of source systems. Live (Online) connection: Live Connection (online) does
How to export reports to Excel, CSV, and PDF with SAP Analytics Designer In this blog, we will be discussing how to export data in the widgets within the analytics application to Excel, CSV, and PDF. This method is the easiest and simplest to apply, and in a subsequent blog,
How to use the setHierarchyLevel() API to set a hierarchy level of a dimension with SAP Analytics Designer In a previous blog we discussed how to addDimensionsToRows(), and addDimensionsToColumns() in the EPM Report Developer Analytics Application. In the same analytics application there is a property value and a hierarchy level
Show and hide report filtering widgets on tabstrip according to tab selection with SAP Analytics Designer In a previous blog we mentioned special filtering requirements. We had to filter the flow as a property of the dimension only on balance sheet related tabs. And the Intercompany dropdown filter only on
How to use the removeDimensionFilter() and setDimensionFilter() API’s with SAP Analytics Designer The removeDimensionFilter() and setDimensionFilter() API’s are used to filter either on members or properties of a dimension on tables and charts with SAP Analytics Cloud Analytics applications. In this blog we used an example that sets filters from
How to use the getDimensions() and getDimensionProperties() API’s with SAP Analytics Designer. getDimensionProperties() Returns all available dimension properties of the specified dimension of a data source. Only supported on data sources from table widgets. Mandatory parameter is dimension name. In this blog we will be sharing an example use case
How to use the getHierarchies() and setHierarchy() APIs with SAP Analytics Designer In this blog post, we will give a comprehensive example of using the getHierarchies() and setHierarchy() APIs with SAP Analytics Designer.The getHierarchies() API is used to return the description and ID of all hierarchies of the dimension. While
How to use the getDataSource() API and its methods and functions with SAP Analytics Designer The getDataSource() function is used to return the corresponding data source whether from a Table, Chart, Geo Map Layer, or from a data frame and data binding, if the data binding has no data source
How to use the getResultSet() APi with SAP Analytics Designer The getResultSet() API is used to return result sets. A result set consists of property-value pairs. The property is a dimension name. The value contains information about the member or measure. You can get an array of result sets with
How to use the getPlanning() API and its methods and functions with SAP Analytics Designer The getPlanning() API returns the Planning object of the table, if the table is linked to a model (data source) that does not support planning, then undefined is returned. This blog is an overview of
How to bookmark selections with SAP Analytics Designer The Bookmark Set allows users to bookmark the current state into multiple versions of the same dashboard and easily switch between different scenarios within the application with SAP Analytics Designer. Bookmarks save all the current filtering selections in the dashboard from dimensions
How to use the addDimensionToColumns(), addDimensionToRows(), getDimensionsOnColumns(), and getDimensionsOnRows with SAP Analytics Designer Wondering how to use the addDimensionToColumns() API?In this blog, we will be explaining how to use: Before we get into the technical part of adding and removing dimensions from rows and columns, I will start with an
How to sort and rank reports with SAP Analytics Designer Sort/Rank reports in SAP Analytics Cloud The InsightCubes Cloud Consolidation solution provides users with sophisticated and flexible Sort & Rank capabilities to navigate their data sets. Sorting & Ranking with SAP Analytics Designer for the EPM report allows you to
How to use the getMembers() API with SAP Analytics Designer. getMembers() method returns a set of members from a specified dimension. This method conducts “a round house trip to the backend”, which is a heavier process than the getResultSet(). However in this blog we will be using getMembers() and specifying
Let us say you want to add a member to a dimension, in the following example we will be using a dimension called scope and a member along with the attributes will be added, the attributes will define the member. To use the planning APIs you must select a planning
Something isn’t Clear?
Feel free to contact us, and we will be more than happy to answer all of your questions.